Floater Domain
Real Time Standard Forecast
Plots of Interest
Plots can be seen here for a floater domain. It will be
on a Mercator projection if close to the equator,
otherwise it will be on a Lambert Projection. Plots will
be updated for interesting weather events. Horizontal
resolutions may vary.
The initial fields and 3.5 day forecasts
(0 to 84 hour forcasts, every 12 hours)
can be seen below by clicking on
the appropriate links (below).
For interesting weather situations, the plots will be updated
up to two times per day. The current floater domain
(corresponding to the forecast pltos below) can be seen
here
Feel free to send any comments (aaron.a.boone@gmail.com).
Floater Case
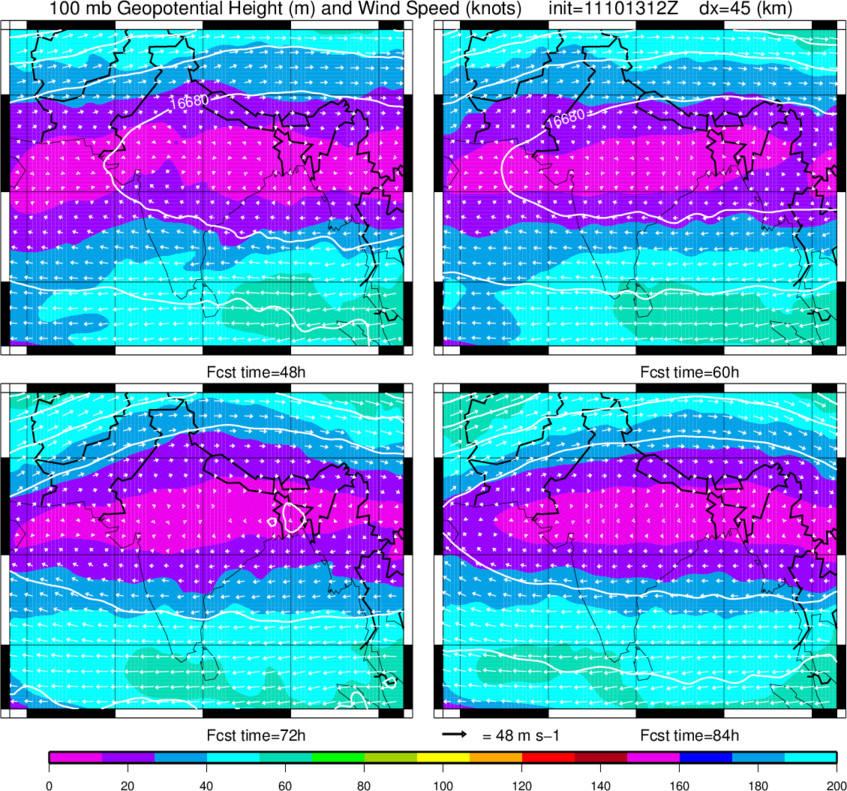
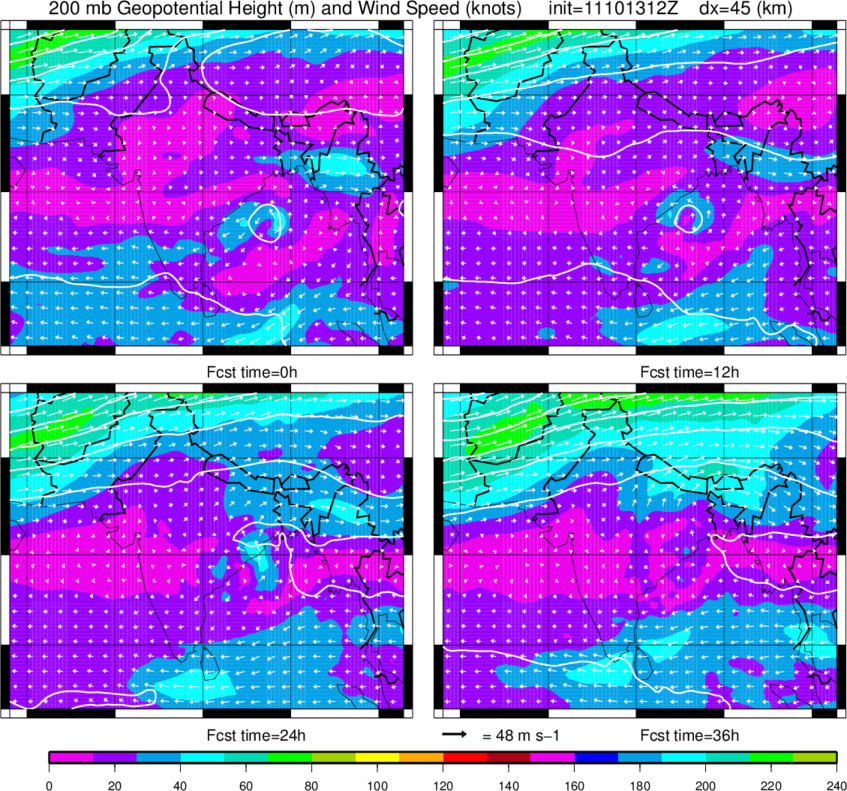
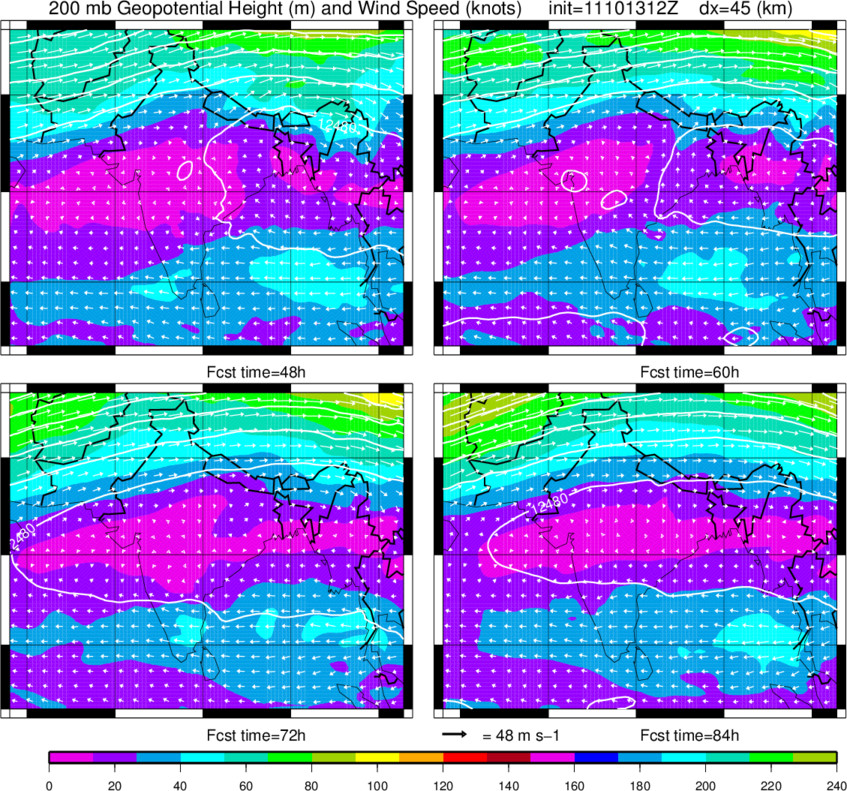
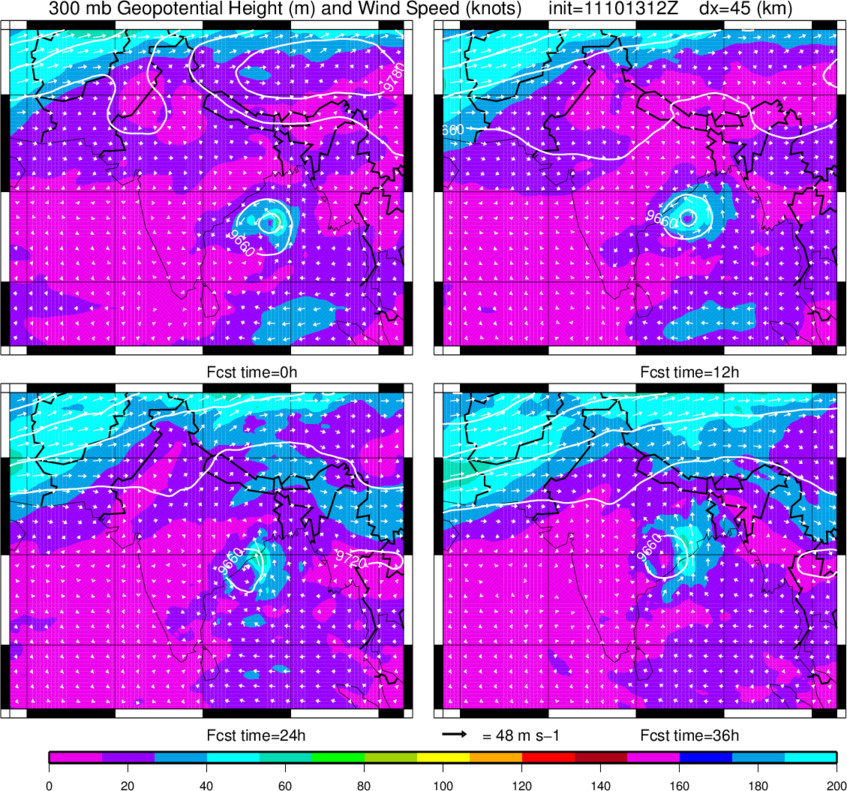
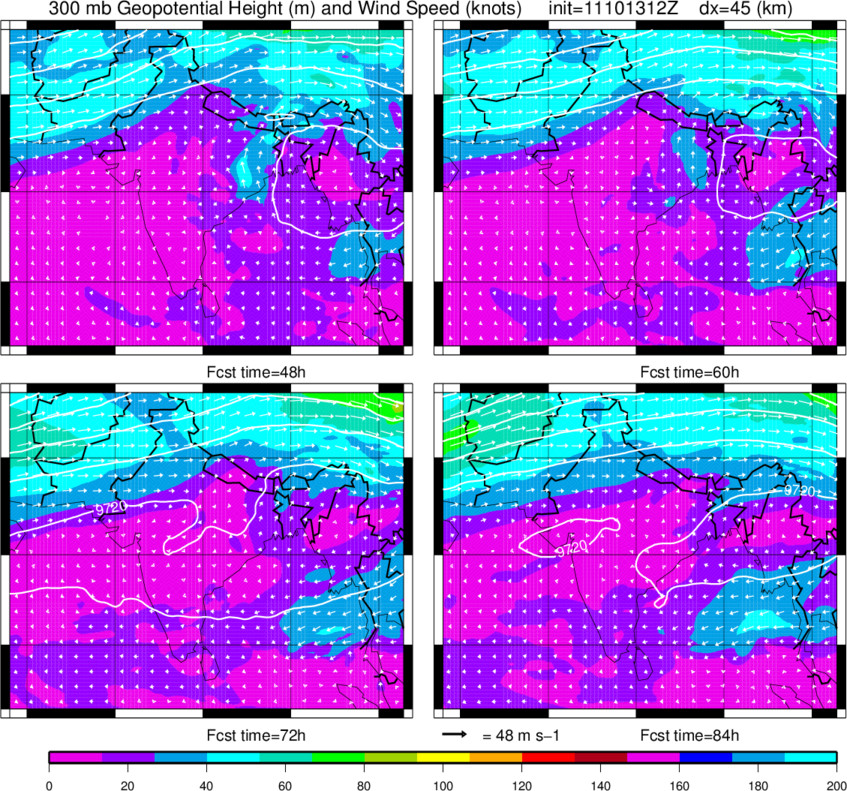
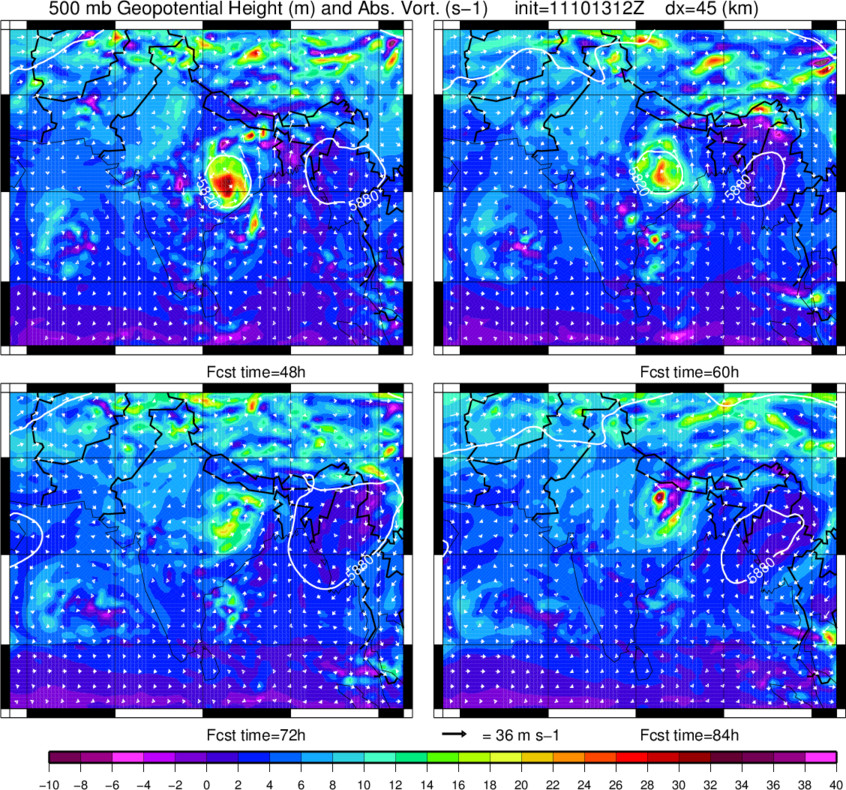
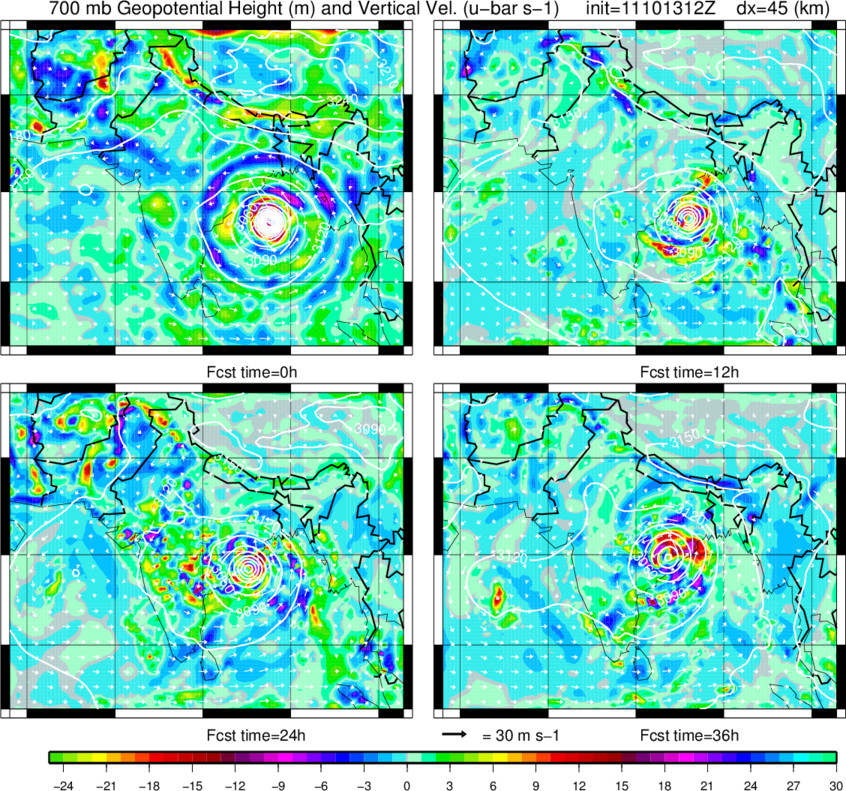
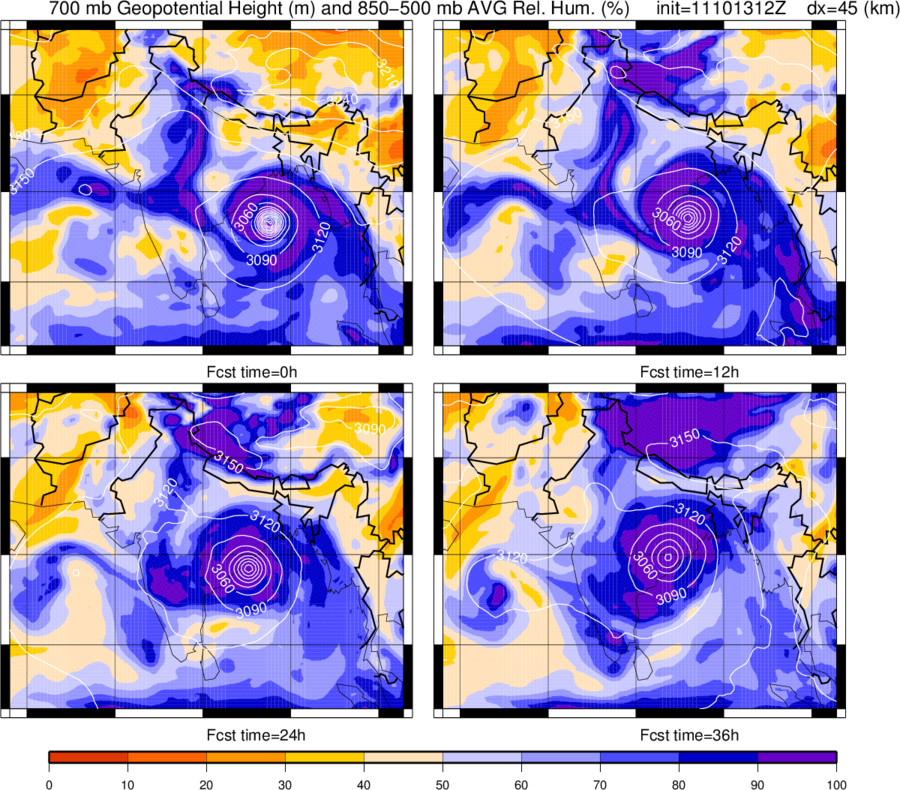
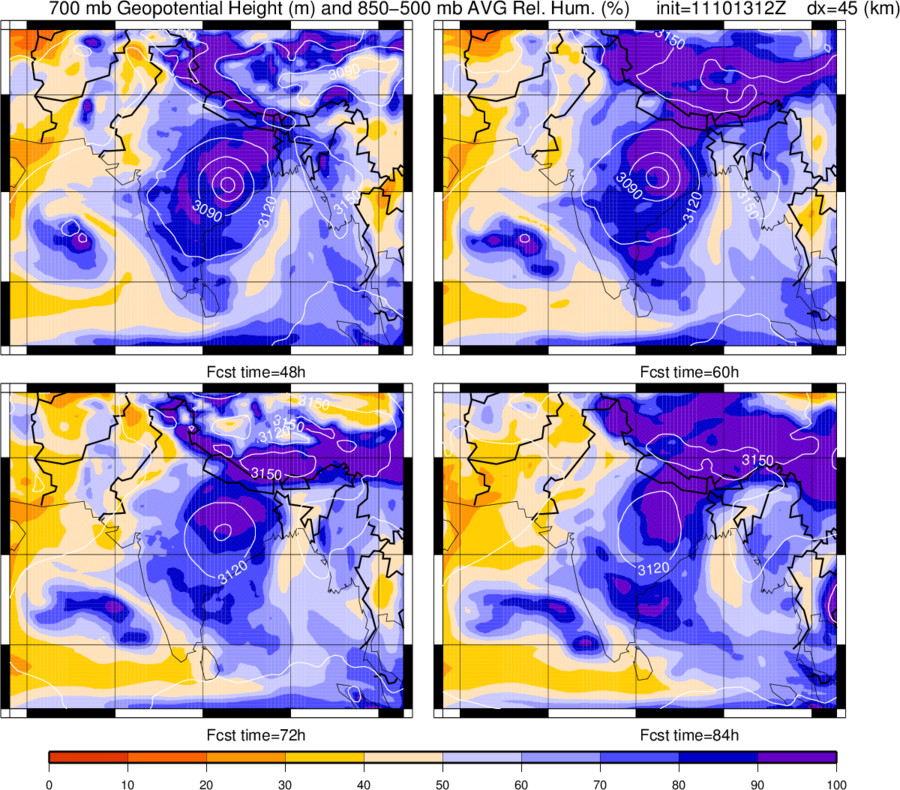
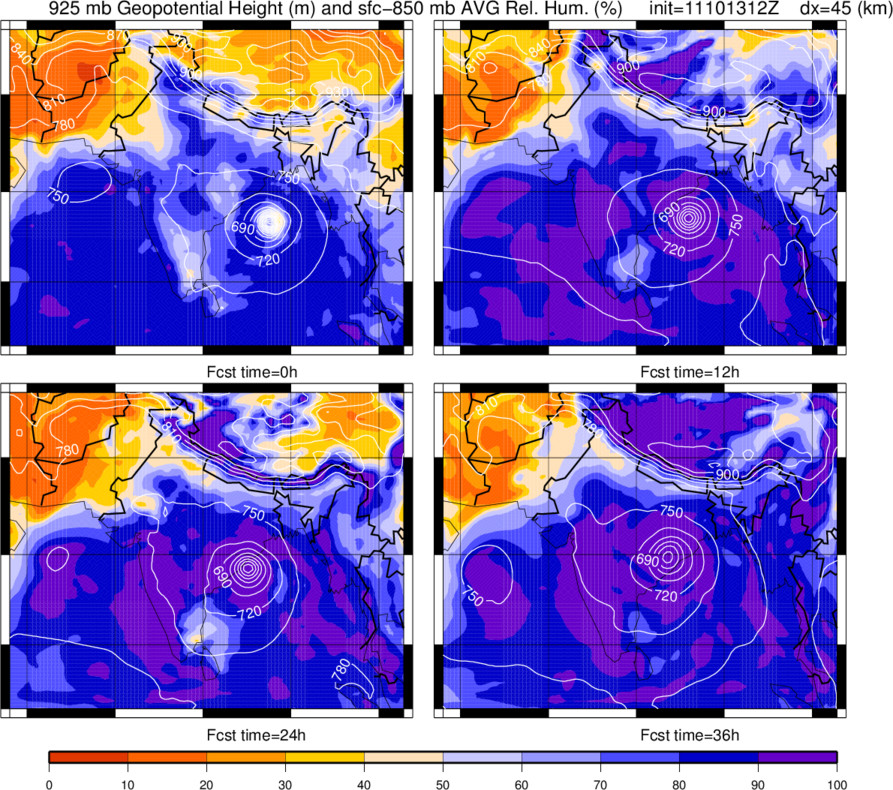
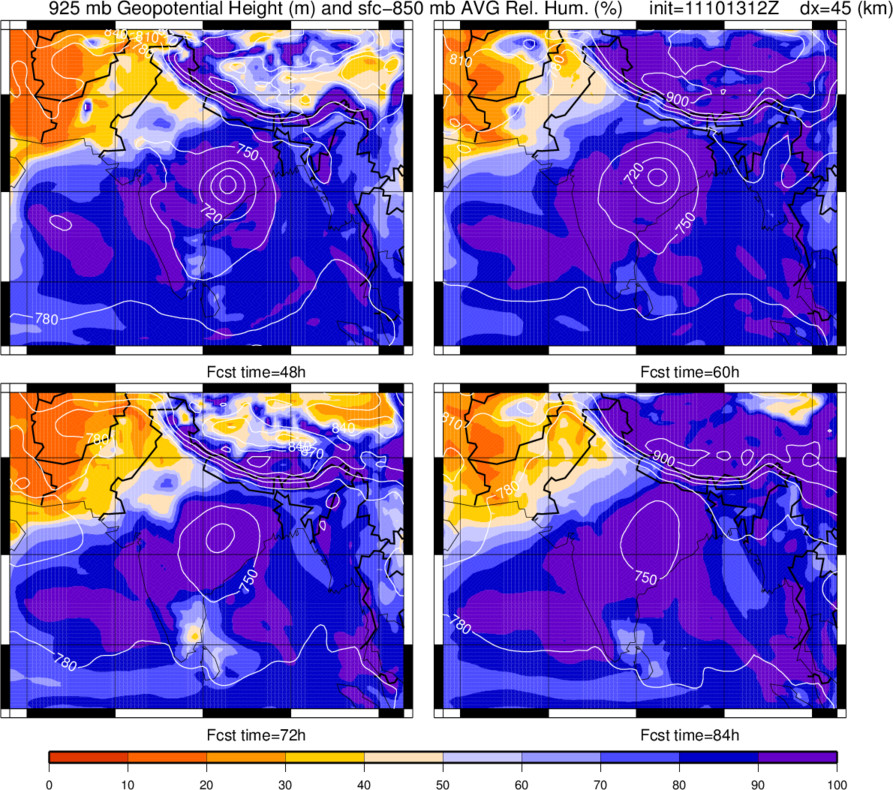
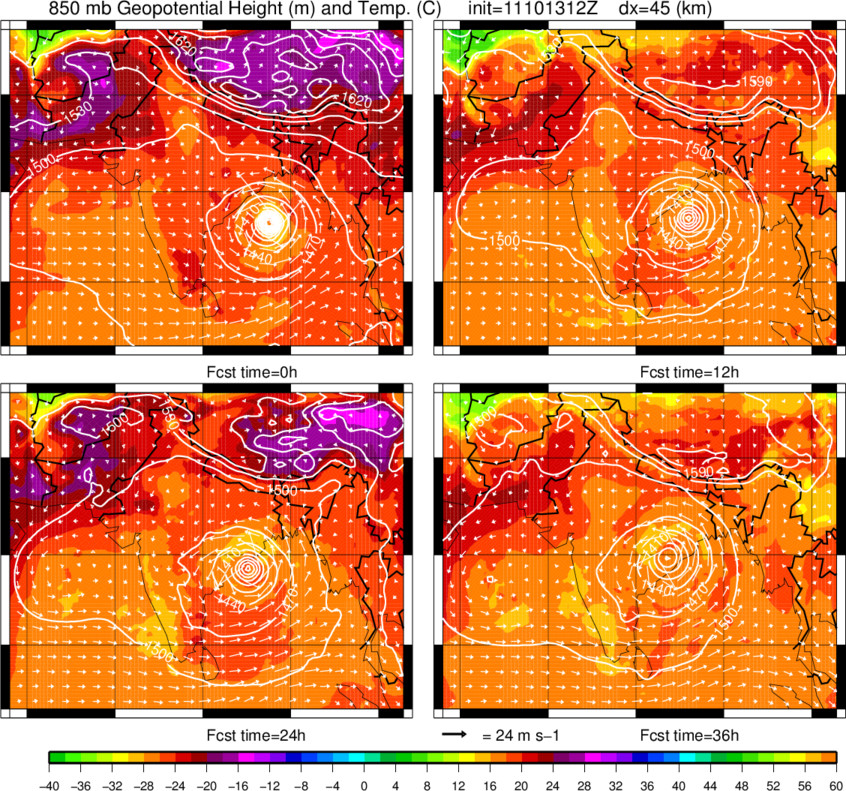
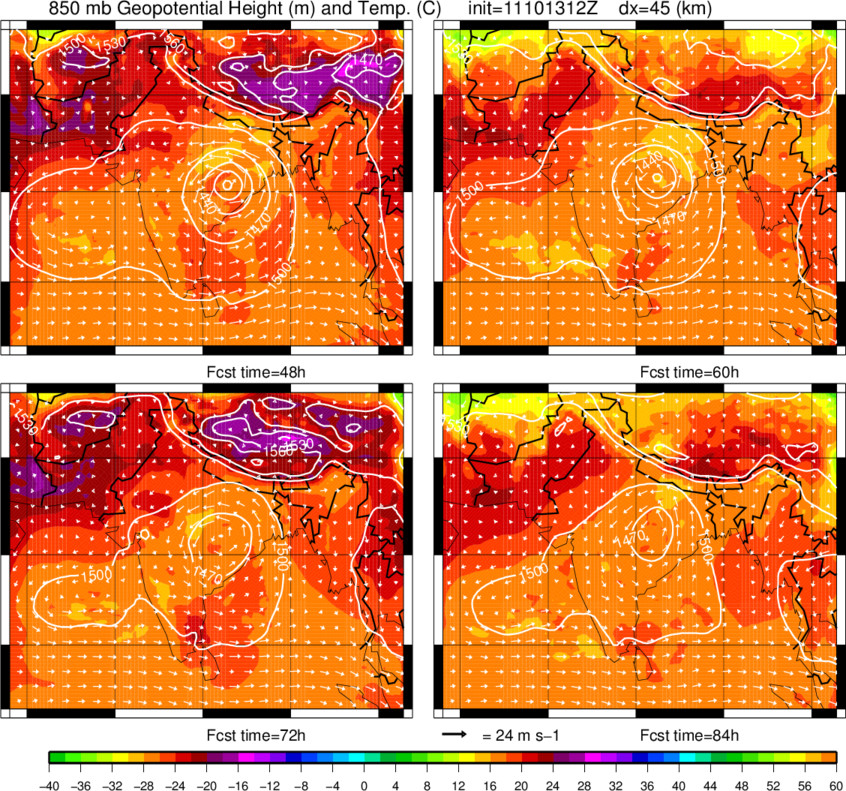
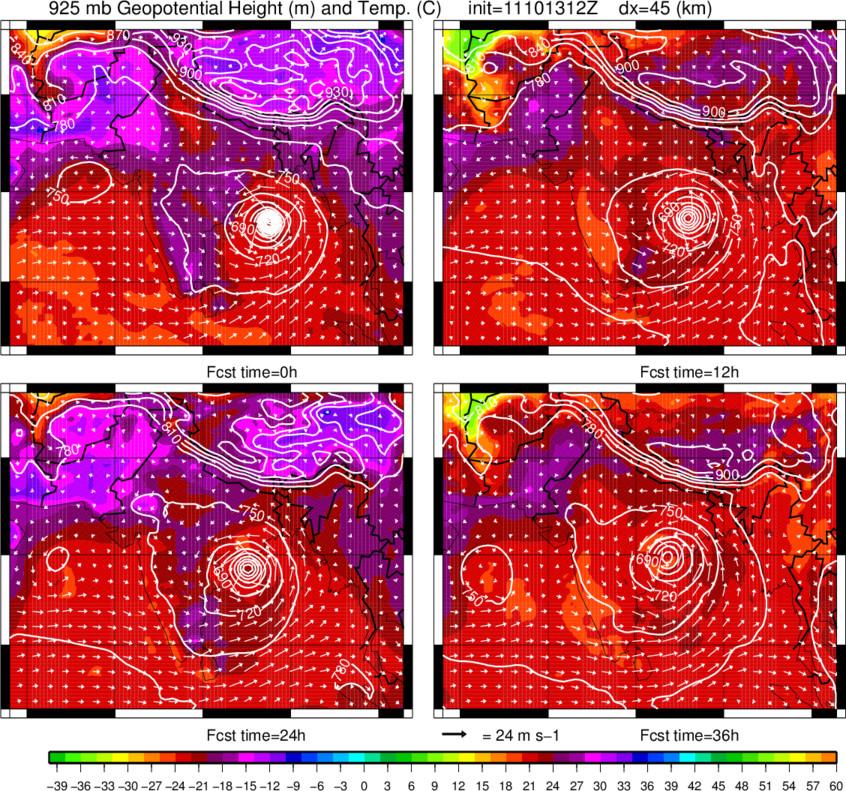
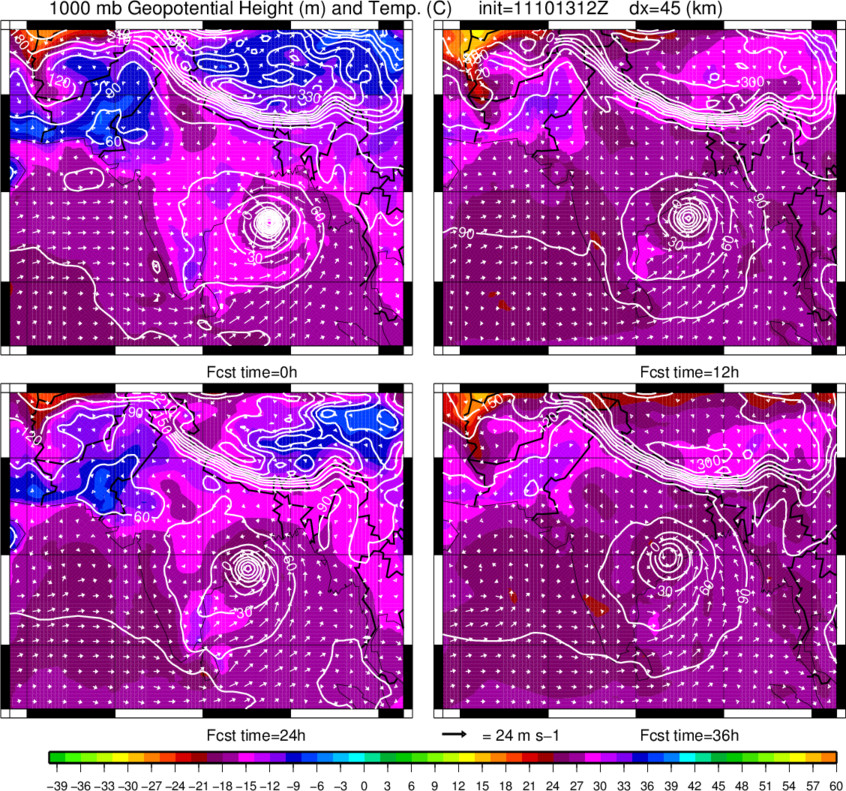
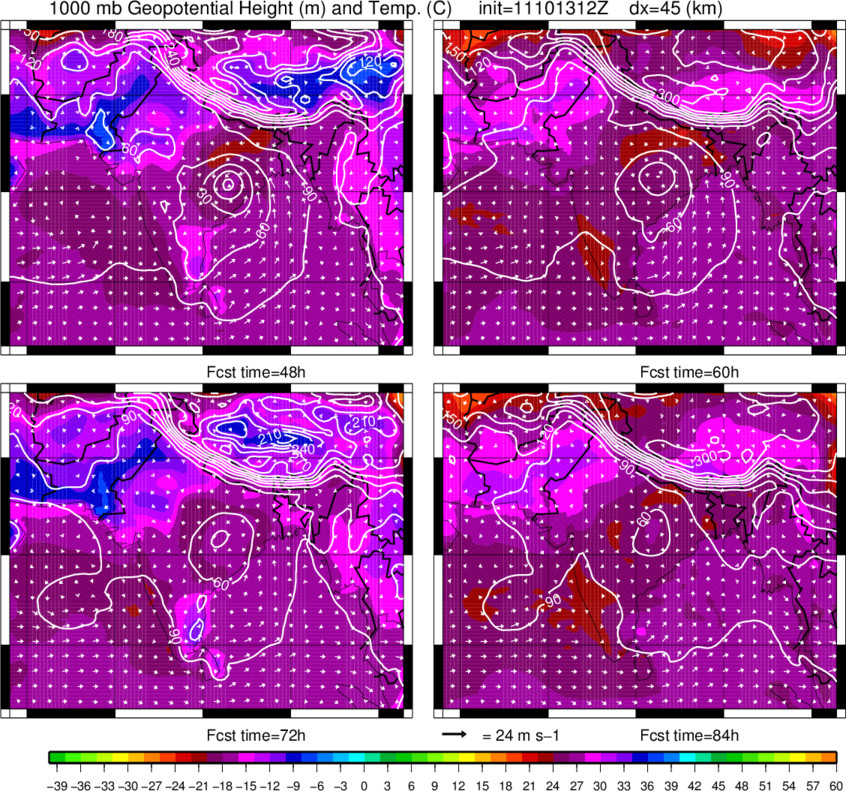
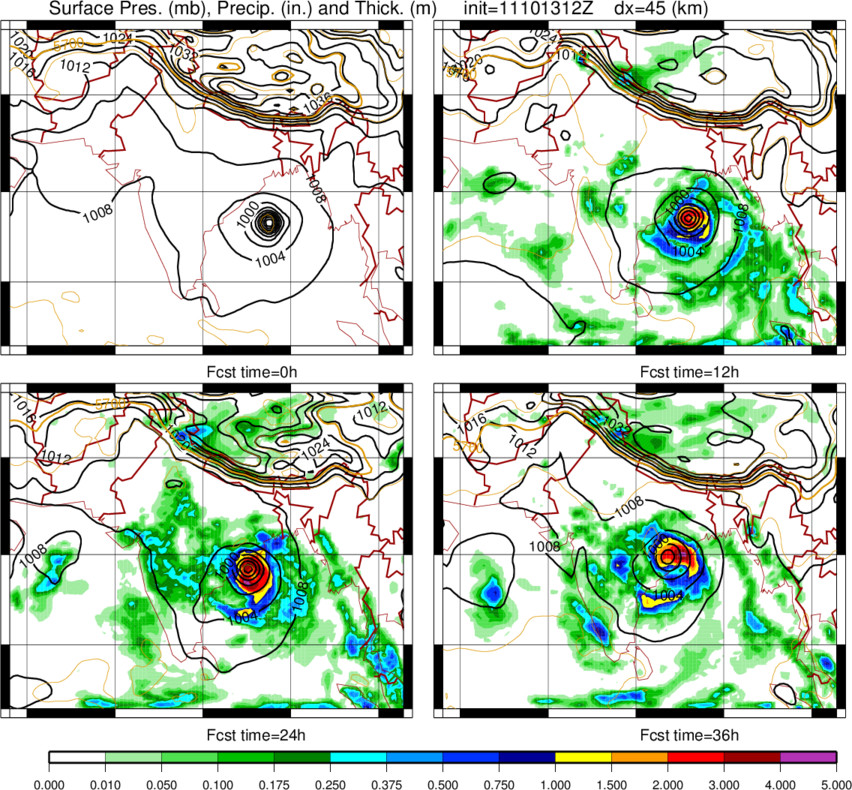
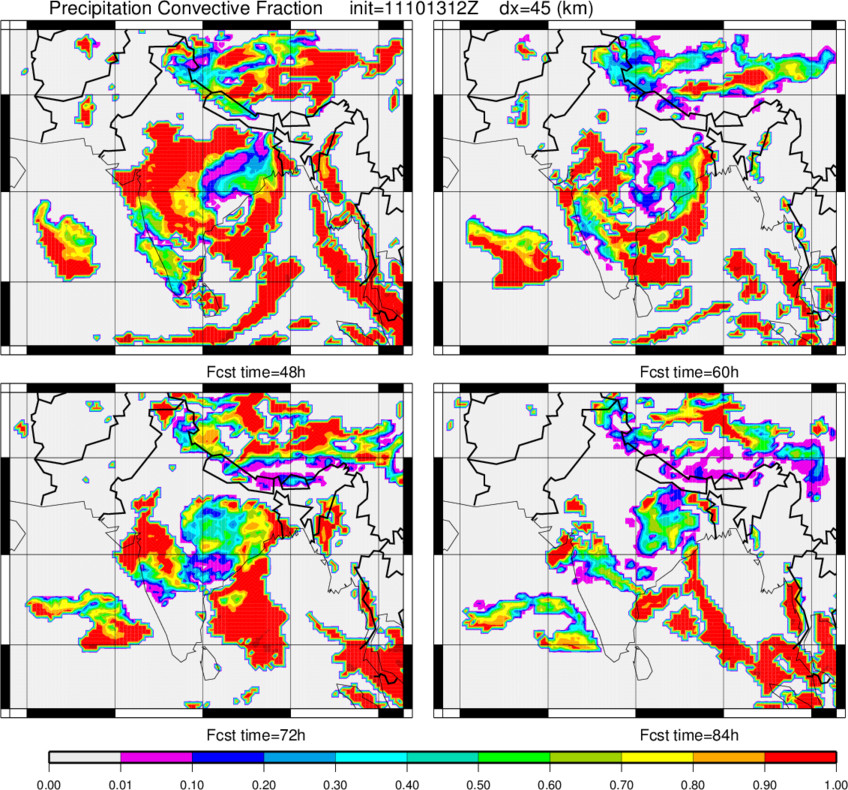
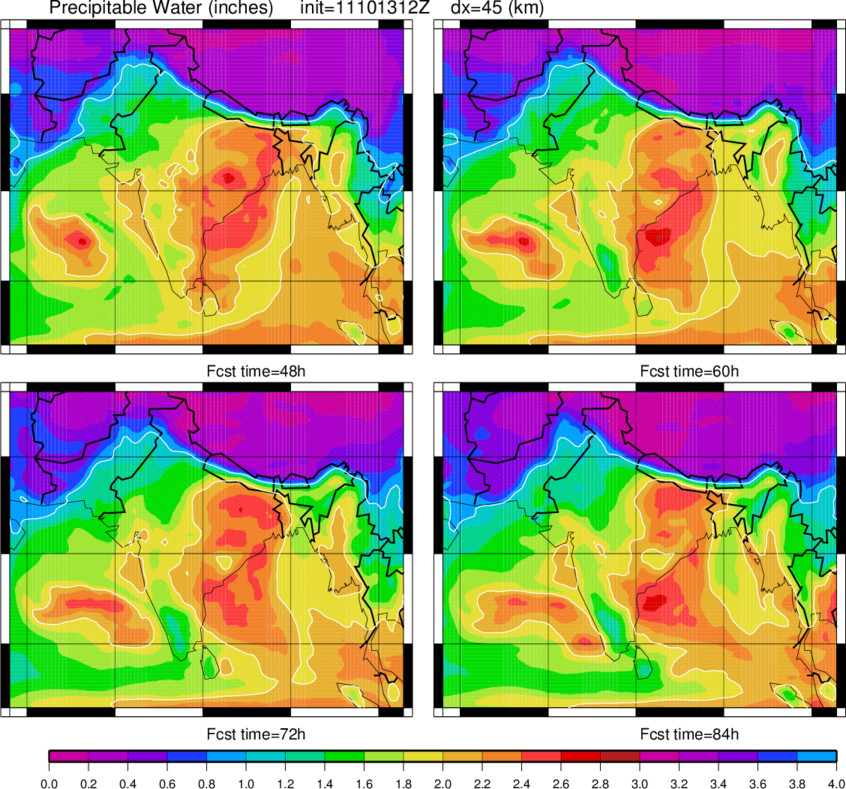
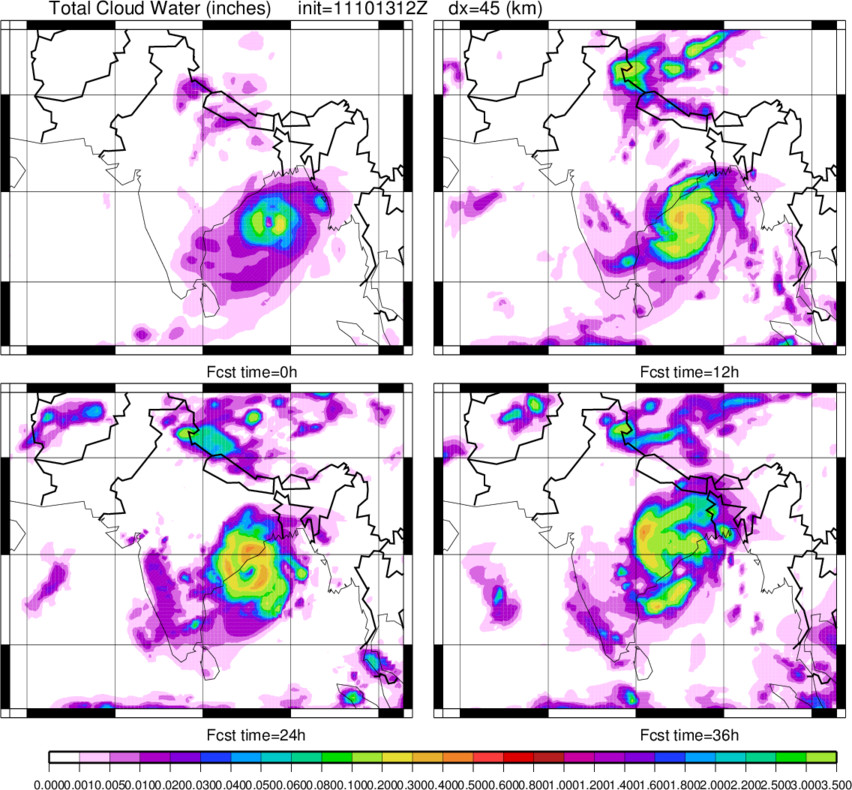
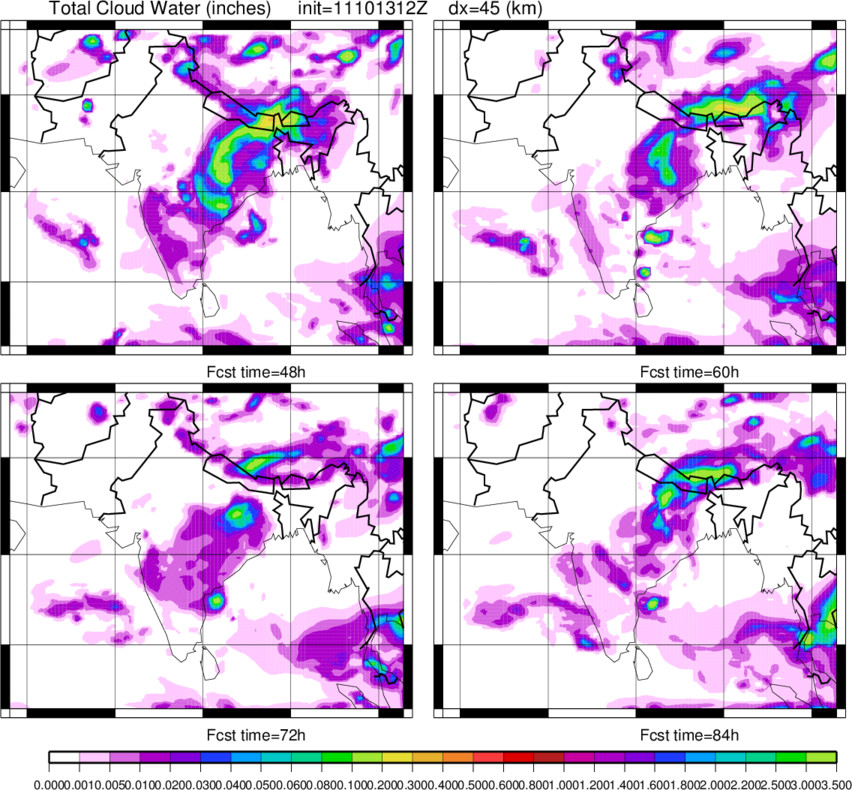
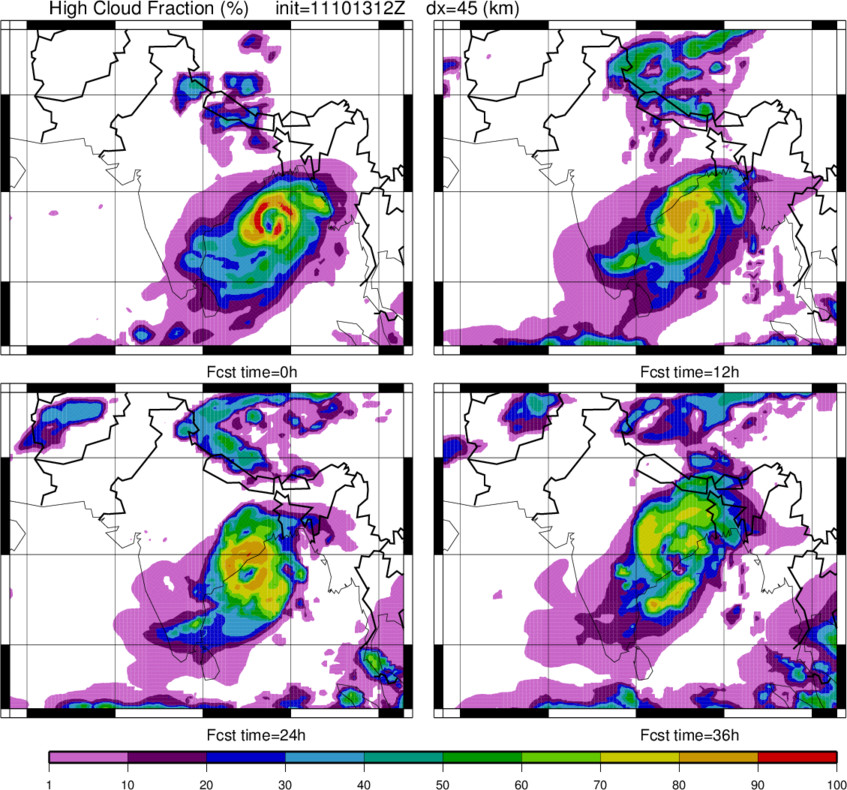
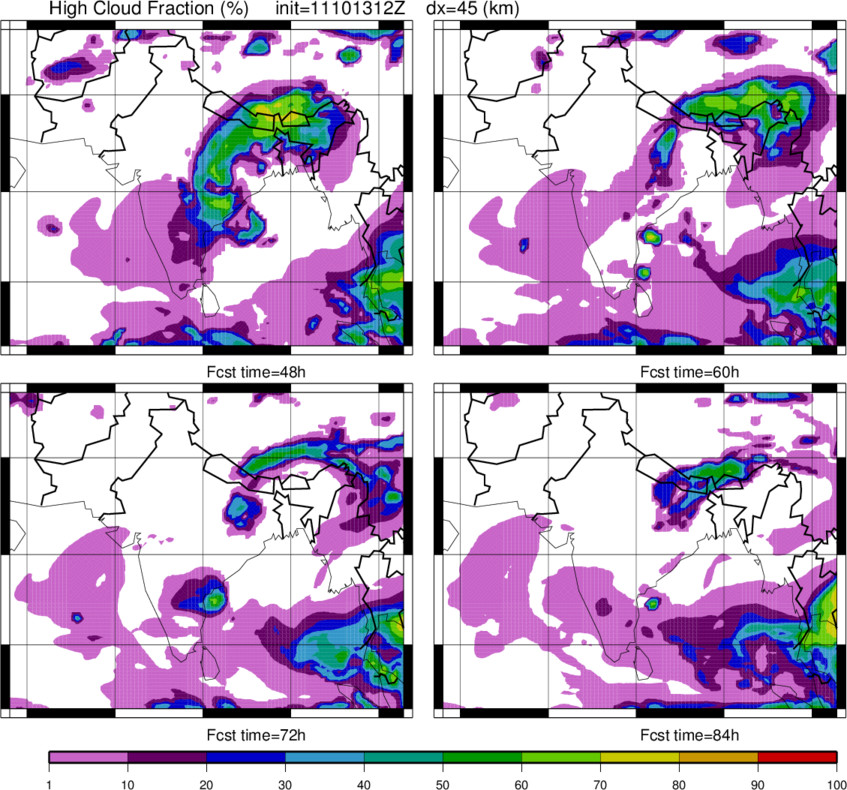
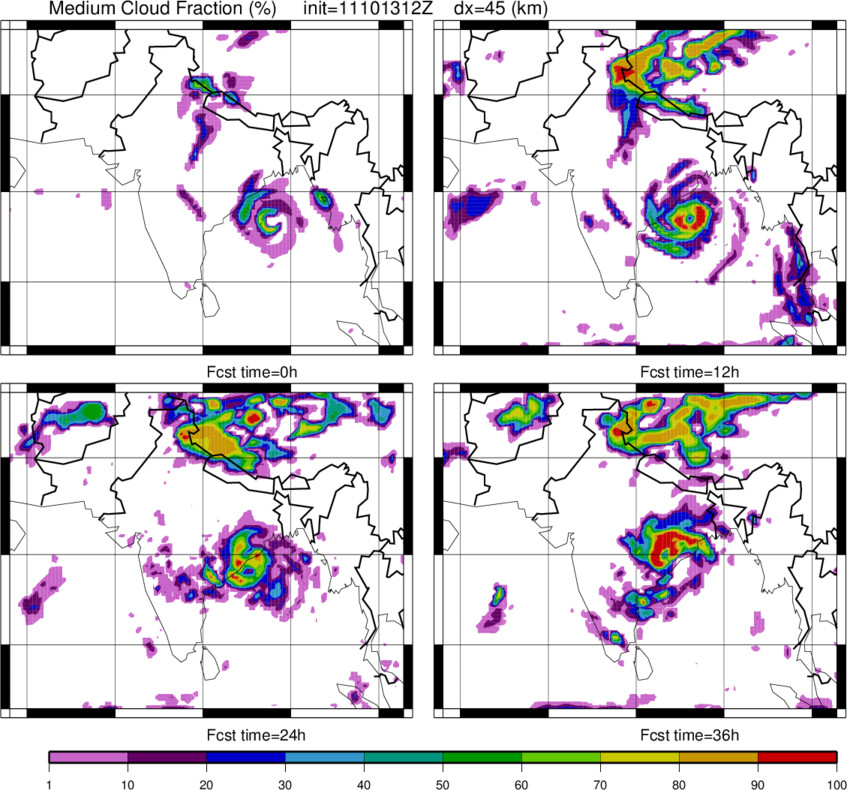
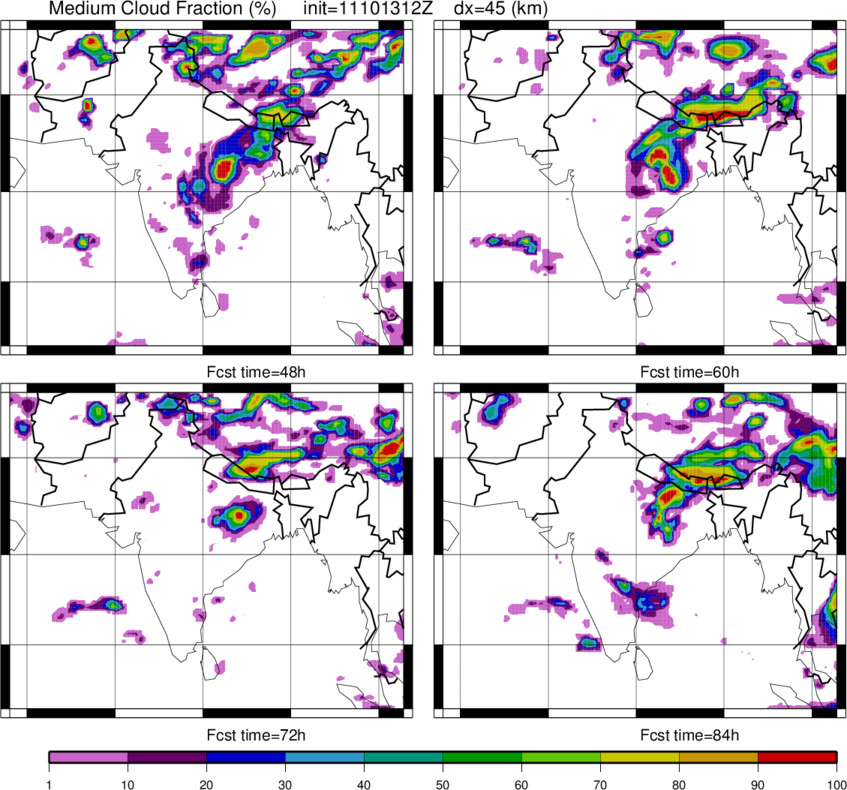
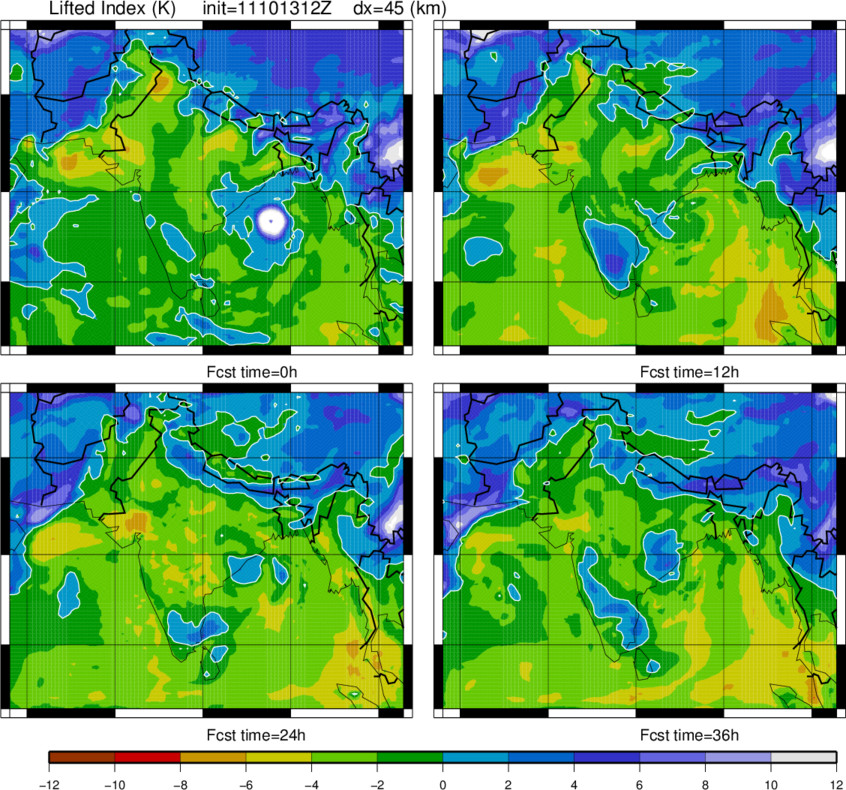
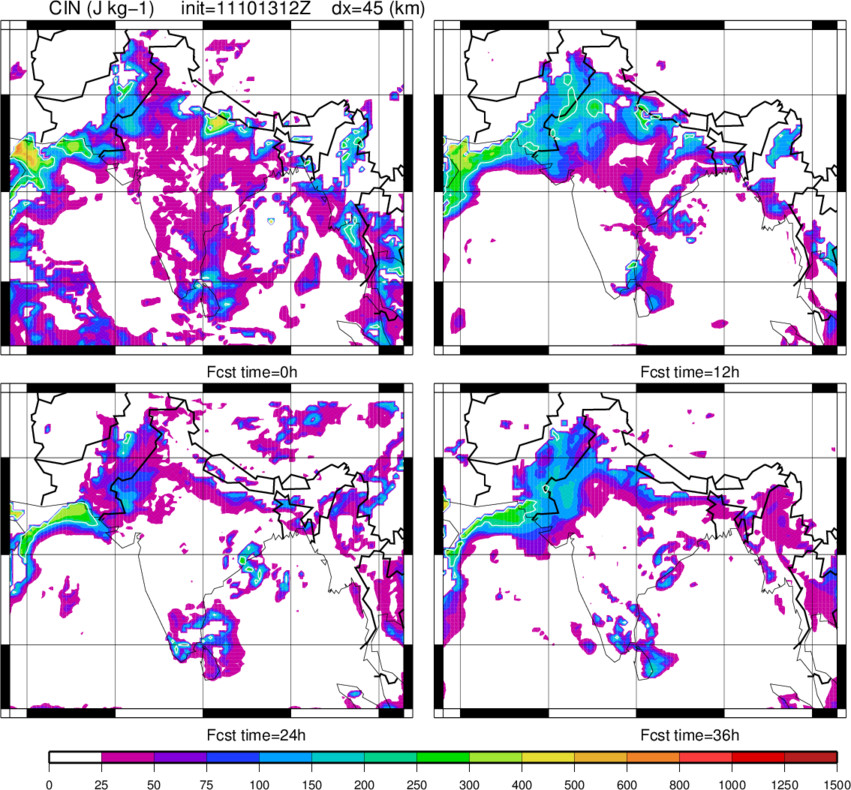
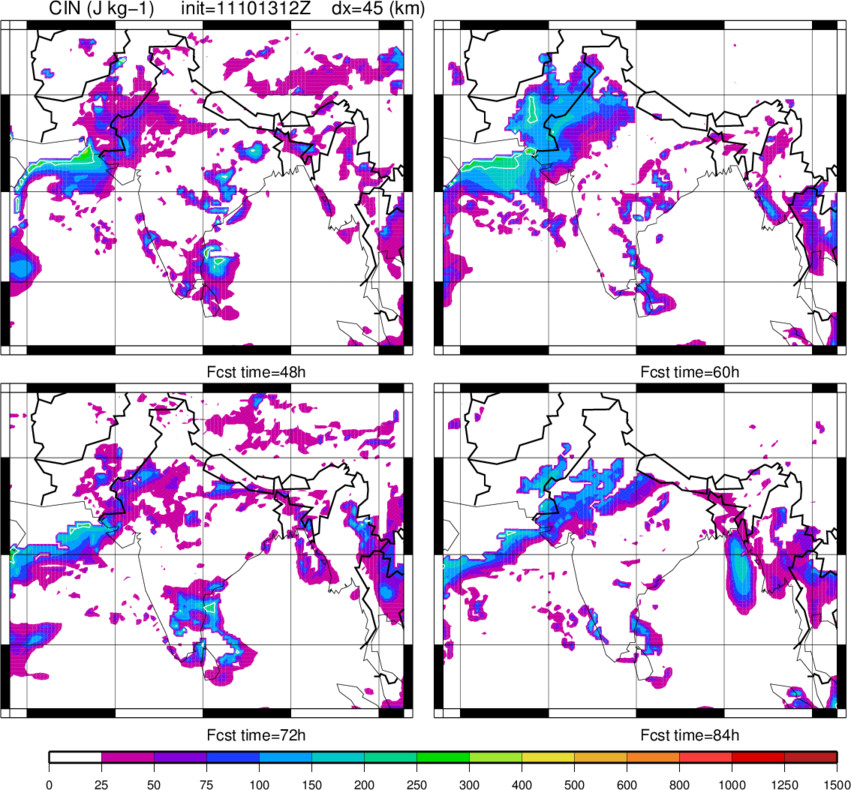
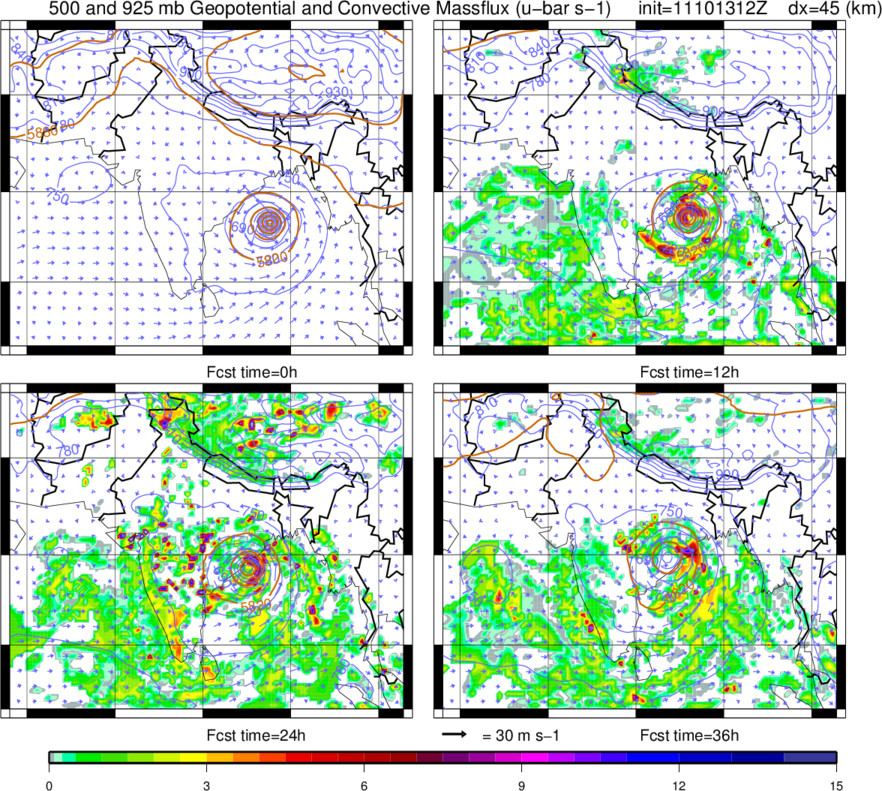
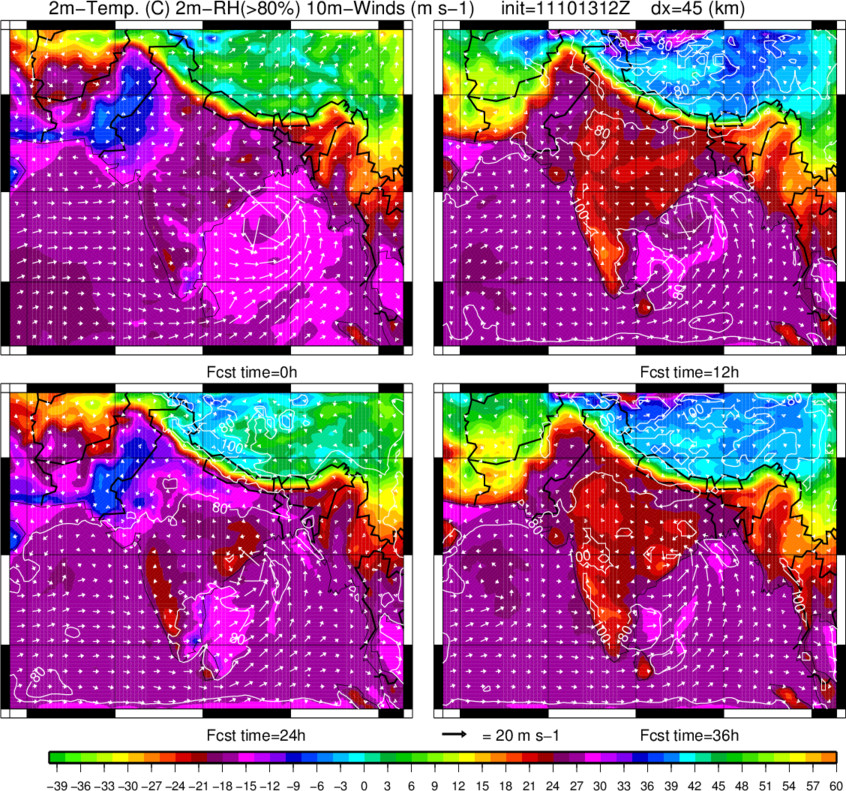
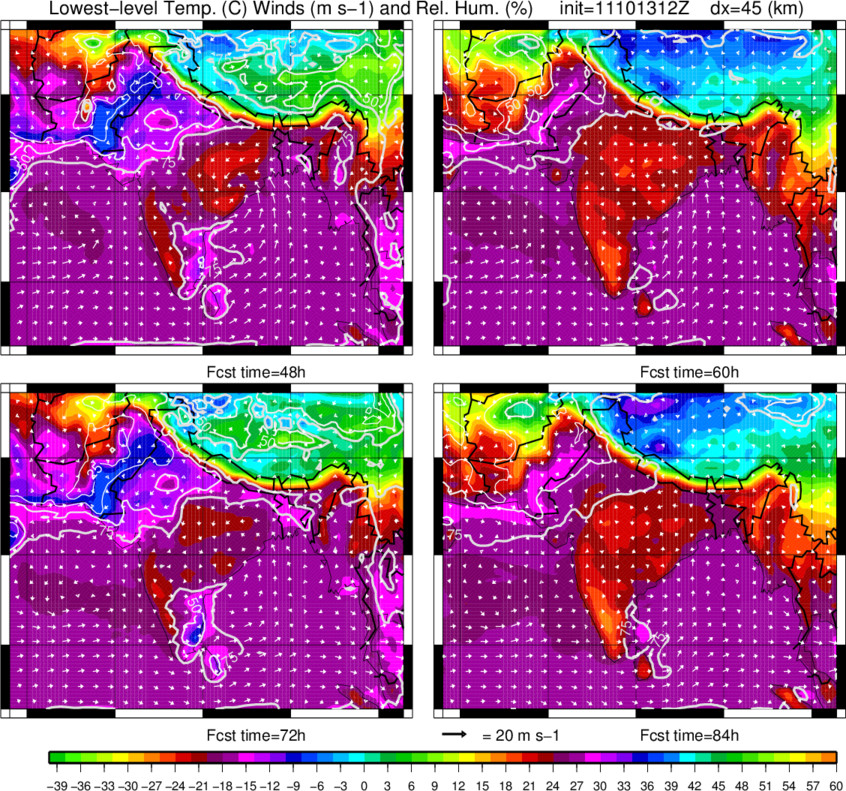
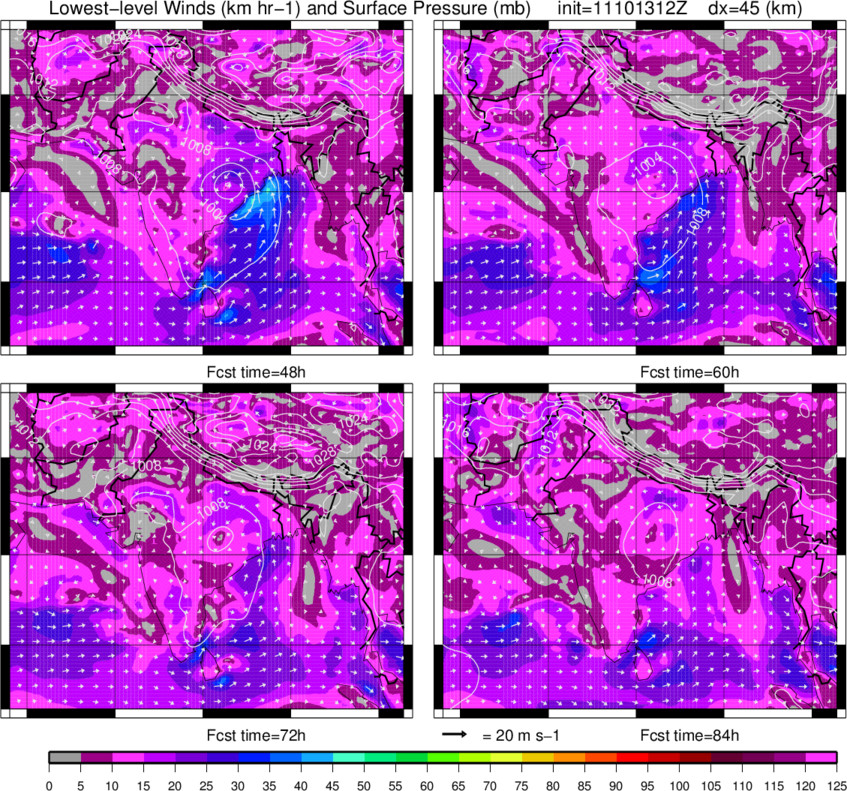
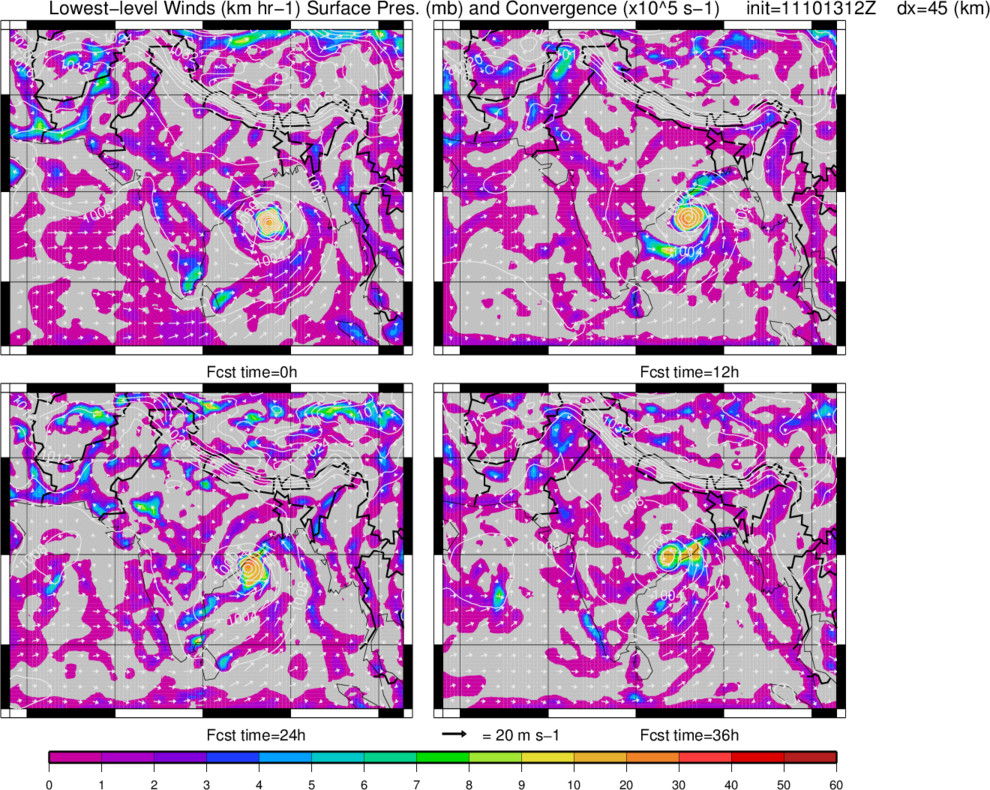
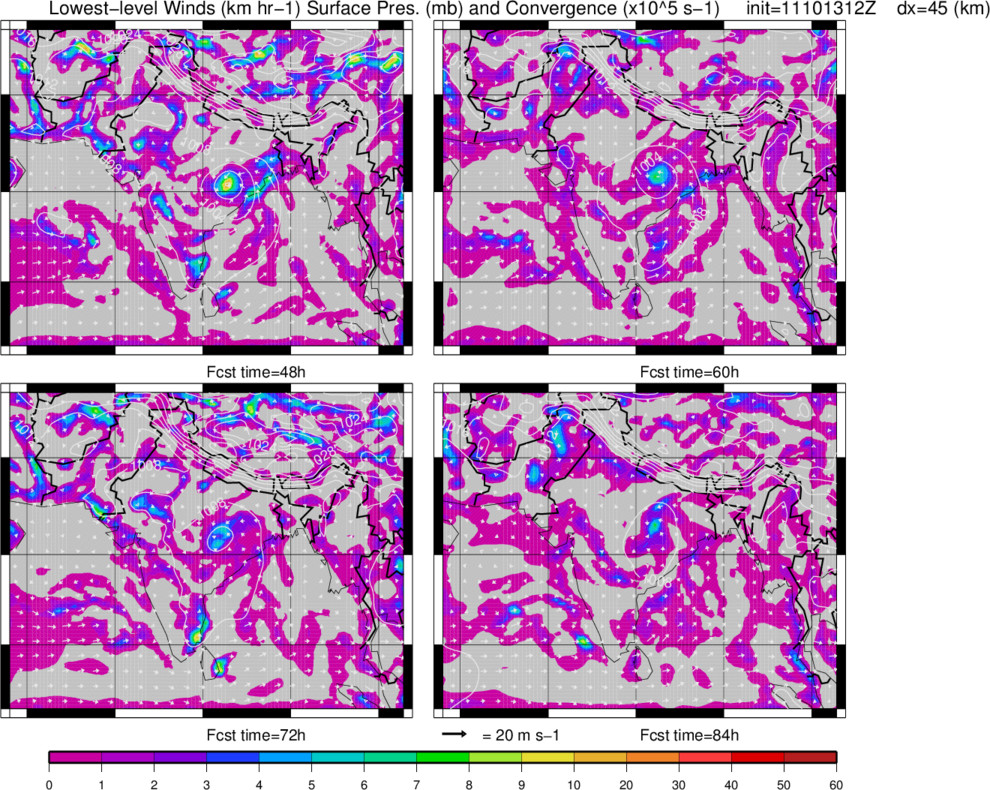
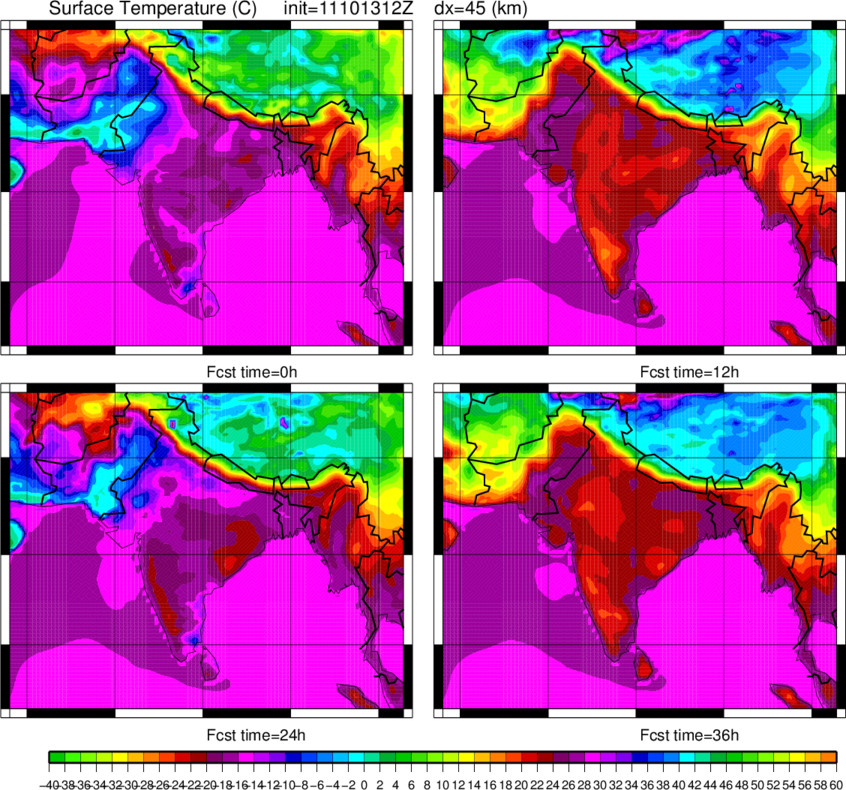
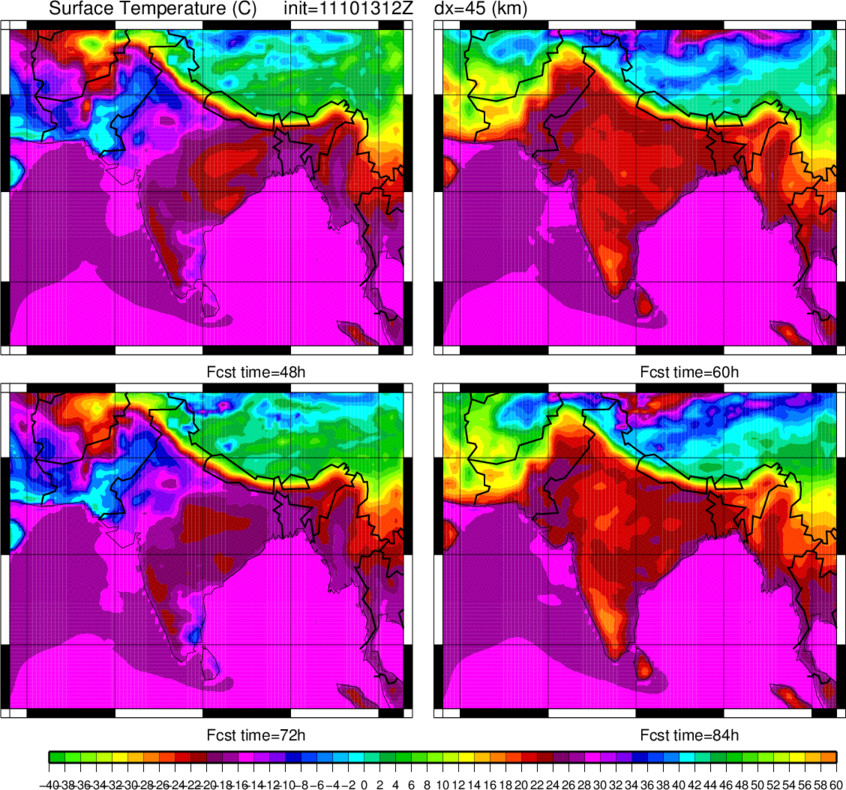
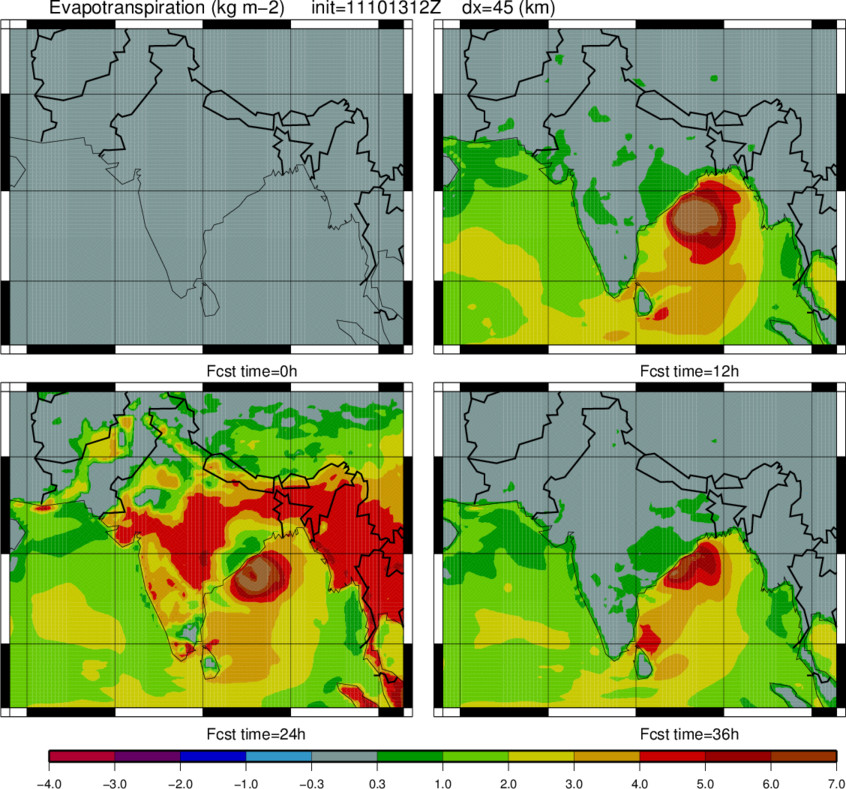
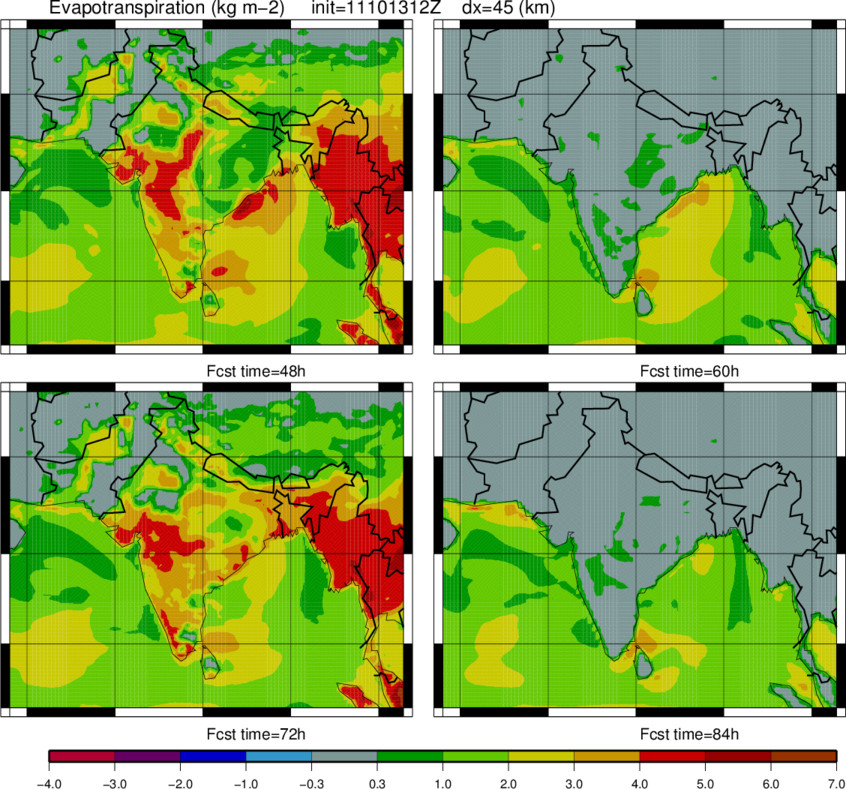
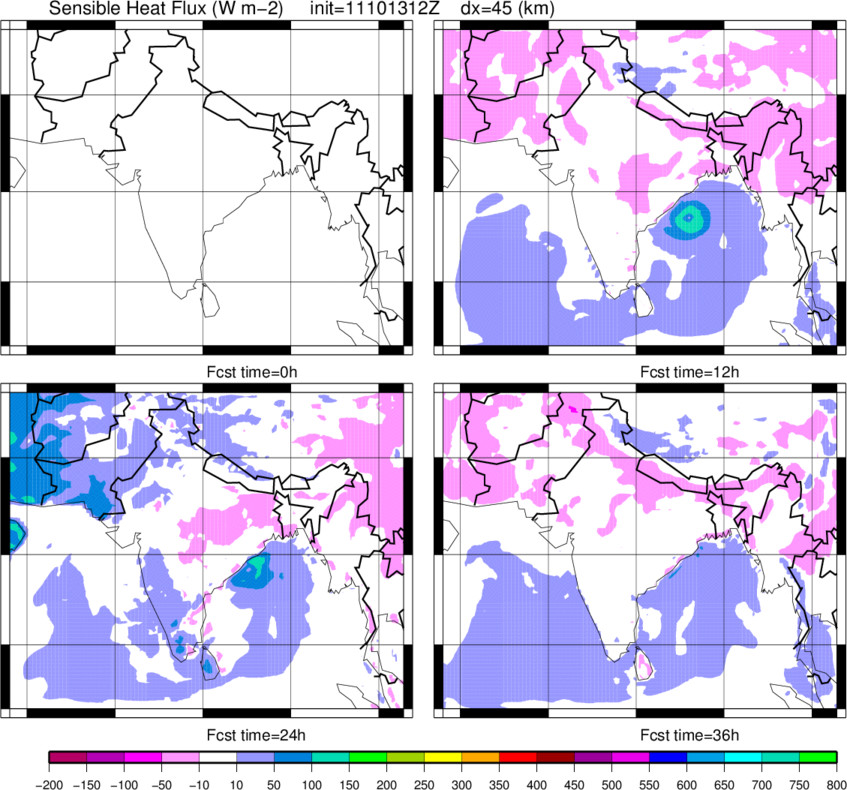
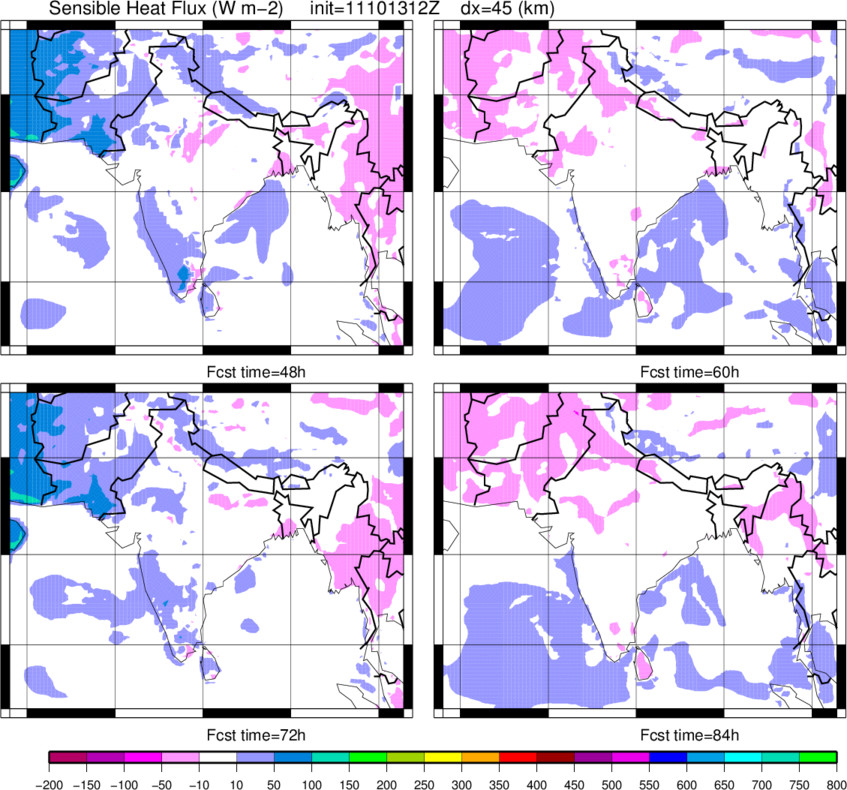
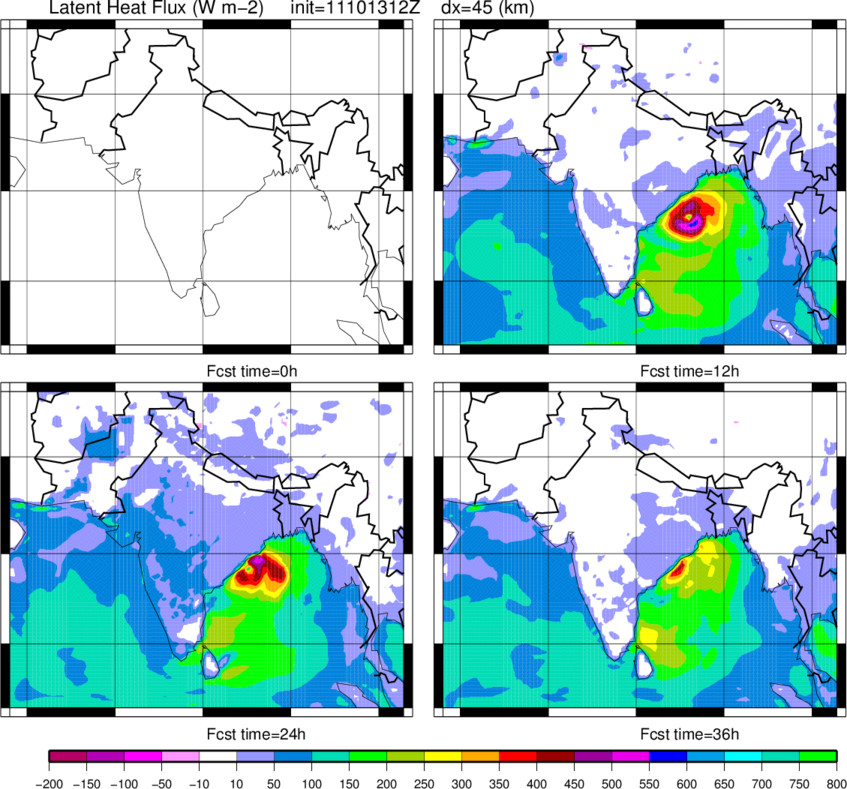
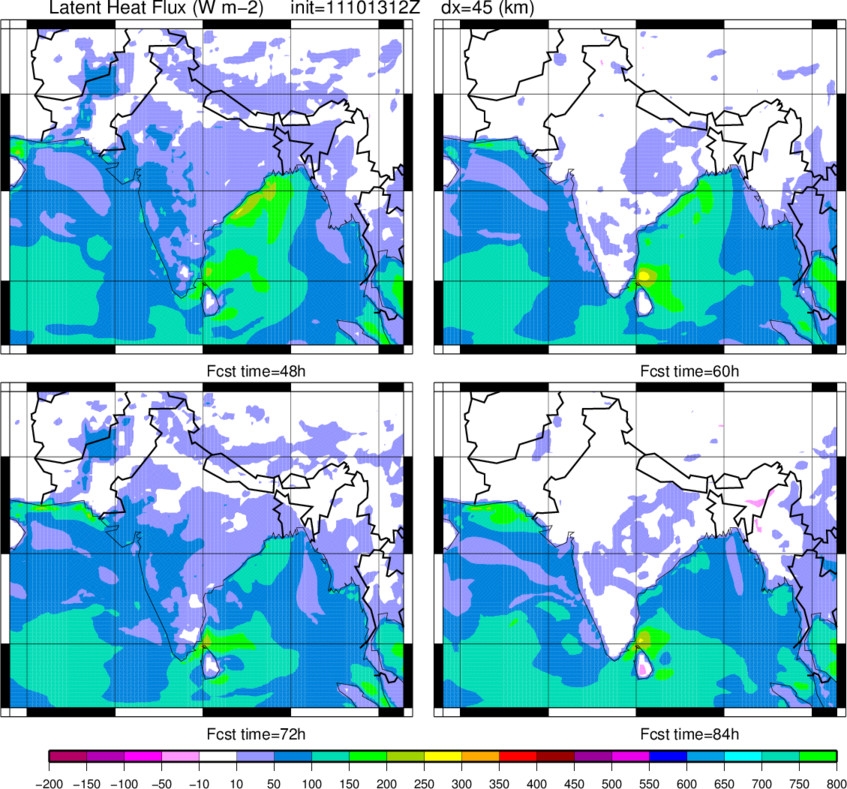
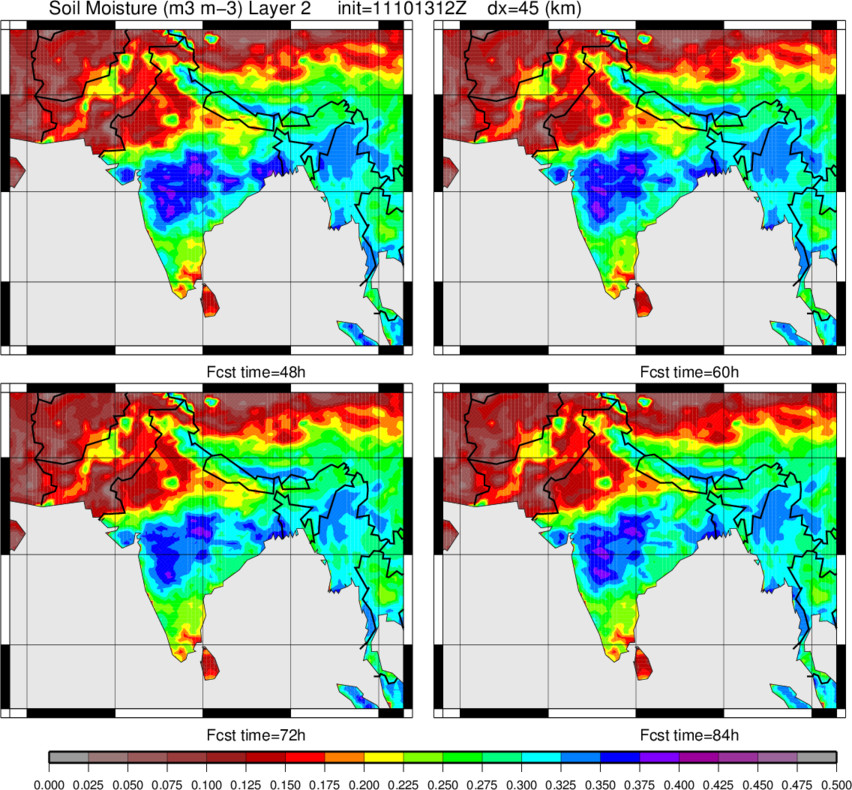
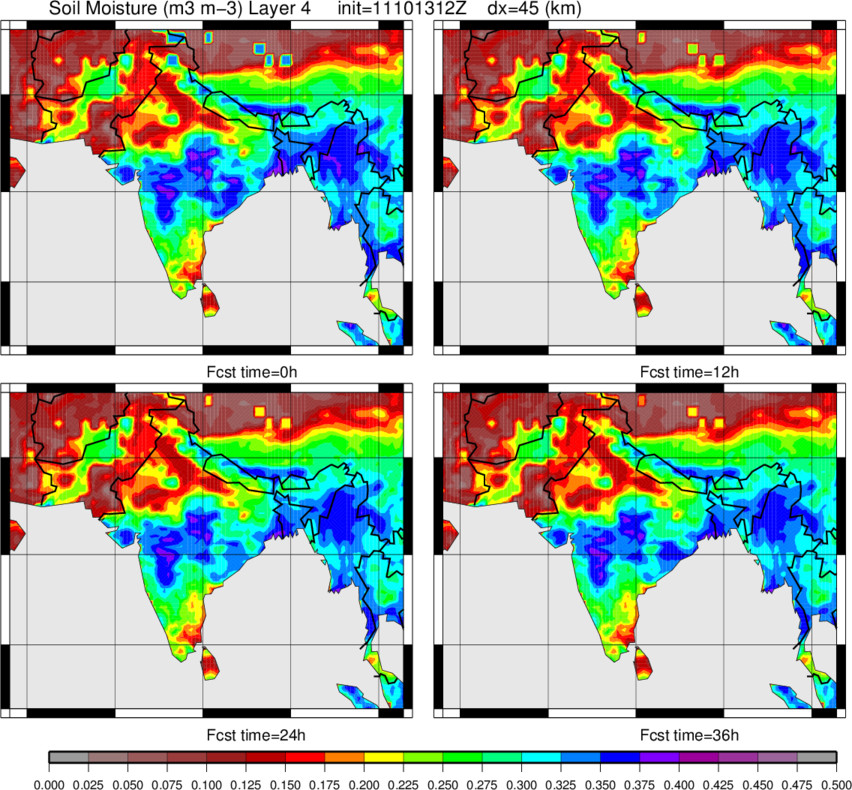
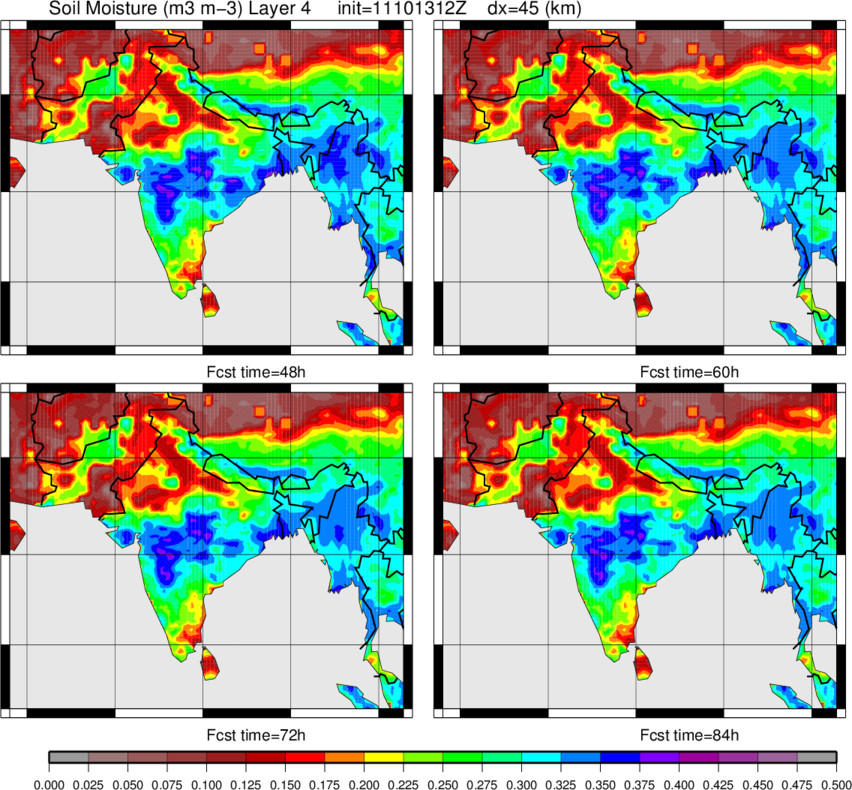
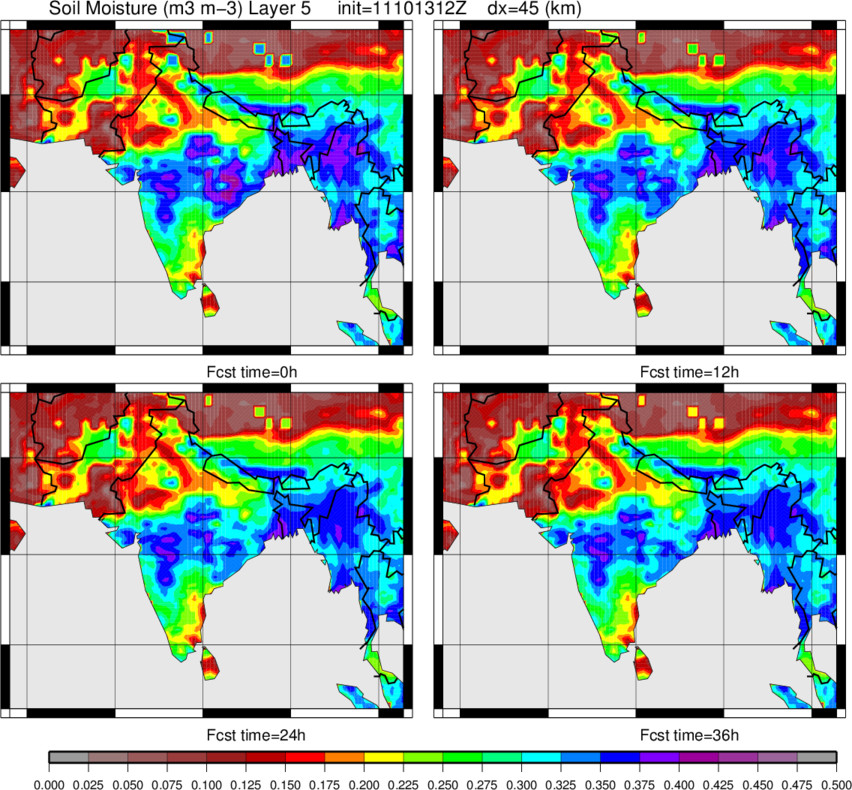
This forecast corresponds to hurricane Phailin, off the
eastern coast of India at initialization (Oct. 11, 12Z, 2013).
| Field | Floater | Floater |
| 100 Hgt, WindV, WindS |
0-36h |
48-84h |
| 200 Hgt, WindV, WindS |
0-36h |
48-84h |
| 300 Hgt, WindV, WindS |
0-36h |
48-84h |
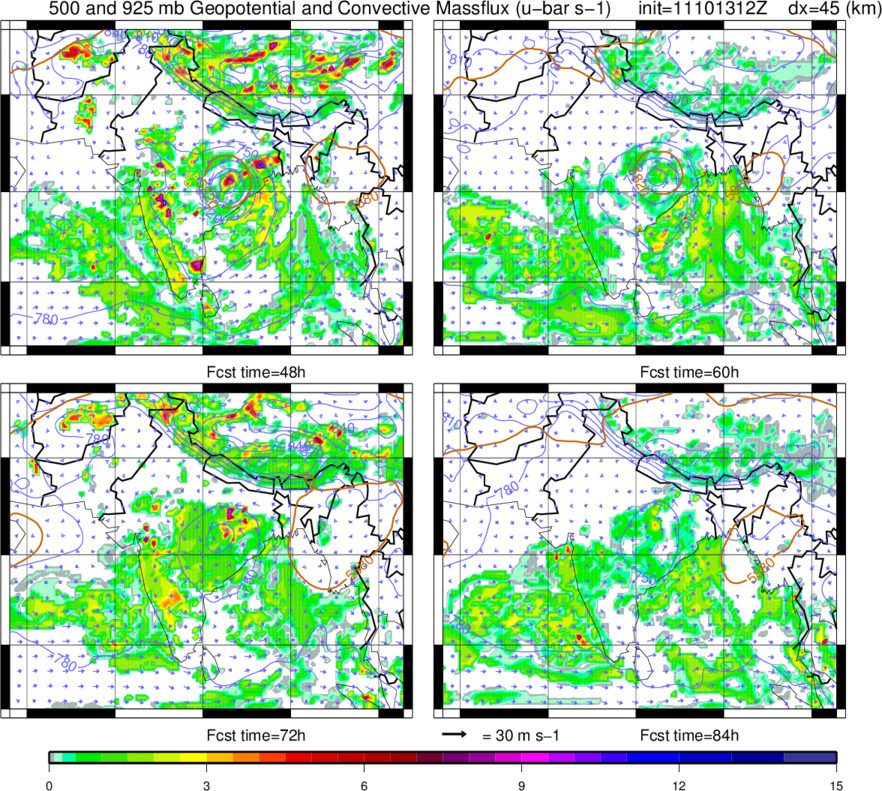
| 500 Hgt, WindV, AbsVort |
0-36h |
48-84h |
| 700 Hgt, WindV, VVel |
0-36h |
48-84h |
| 700 Hgt, 850-500 mb RHavg |
0-36h |
48-84h |
| 925 Hgt, surf-850 mb RHavg |
0-36h |
48-84h |
| 850 Hgt, WindV, Tair |
0-36h |
48-84h |
| 925 Hgt, WindV, Tair |
0-36h |
48-84h |
| 1000 Hgt, WindV, Tair |
0-36h |
48-84h |
| PSurf, Total Precip, 500-1000 Thck |
0-36h |
48-84h |
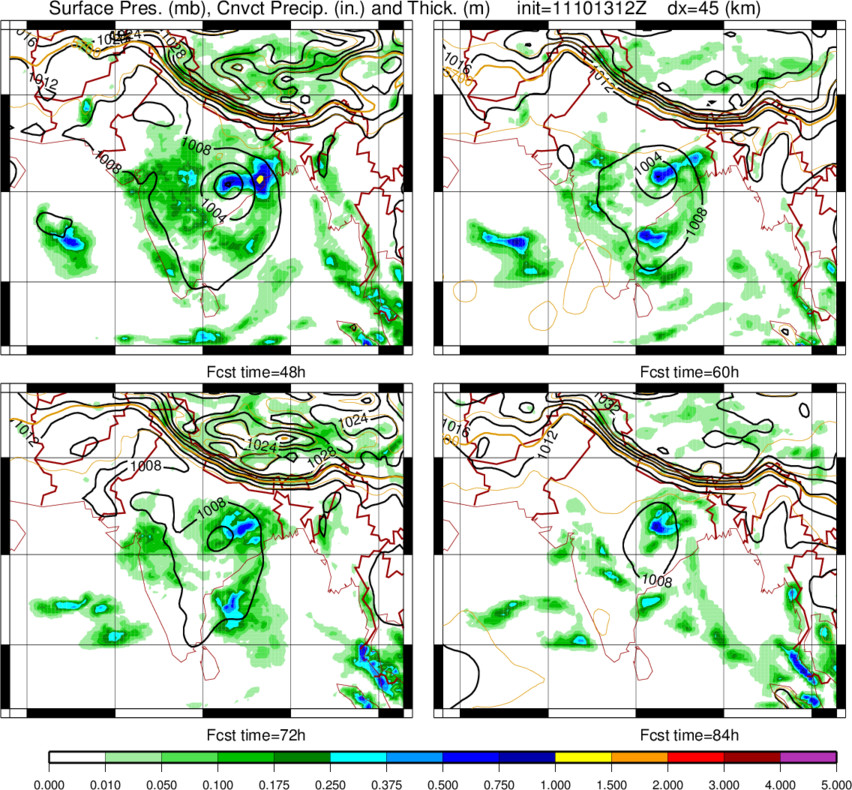
| PSurf, Convct Precip |
0-36h |
48-84h |
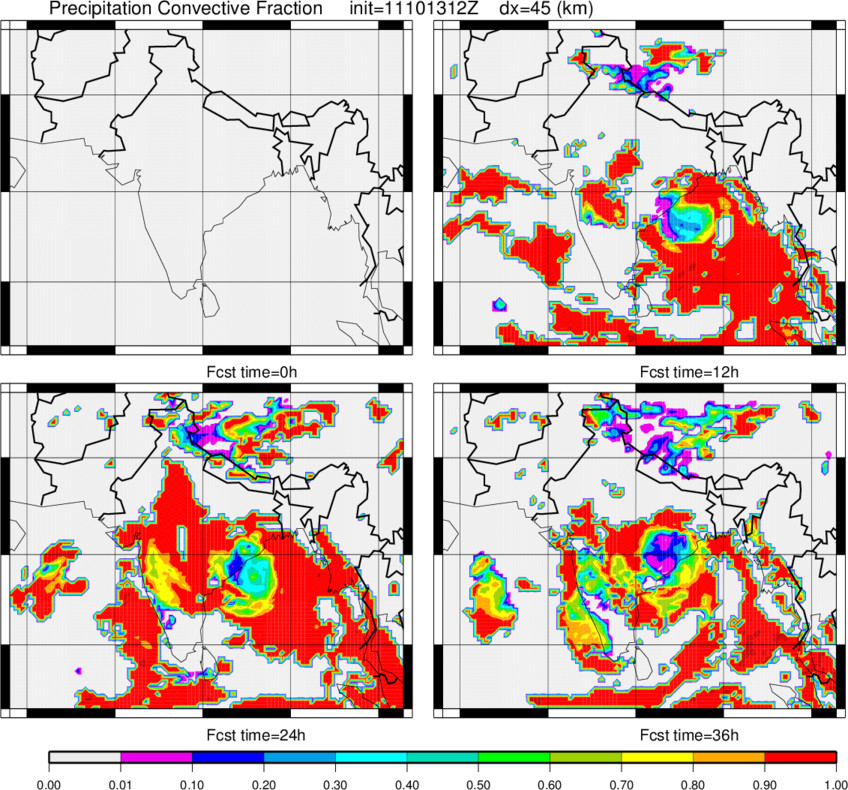
| PSurf, Convect Precip Frac |
0-36h |
48-84h |
| Precipitable Water |
0-36h |
48-84h |
| Cloud Water |
0-36h |
48-84h |
| High level Clouds (fraction) |
0-36h |
48-84h |
| Medium level Clouds (fraction) |
0-36h |
48-84h |
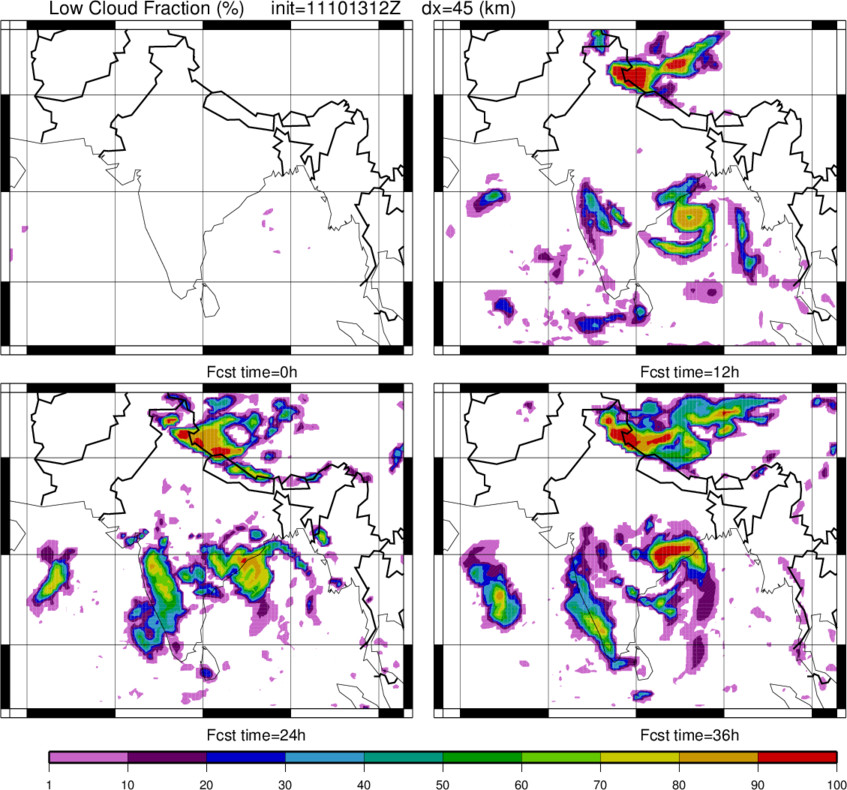
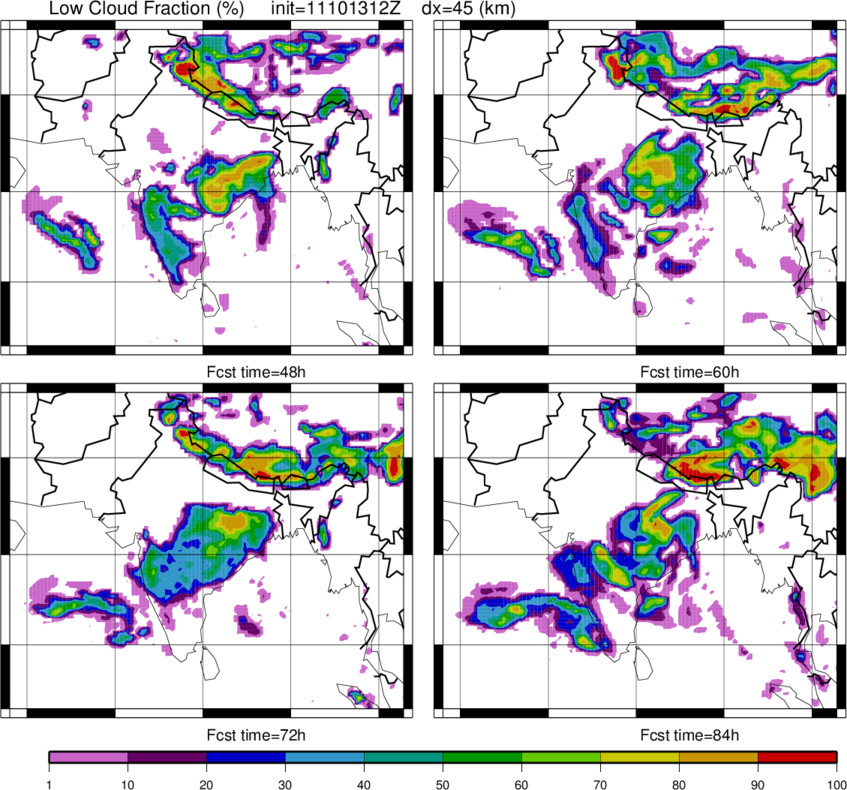
| Low level Clouds (fraction) |
0-36h |
48-84h |
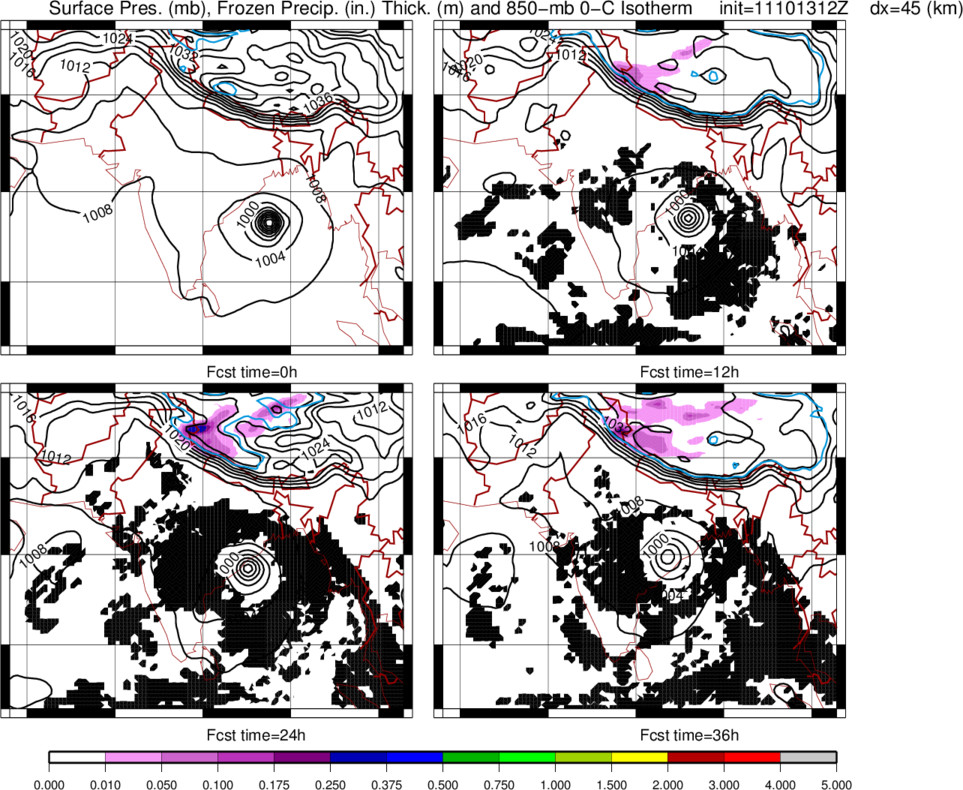
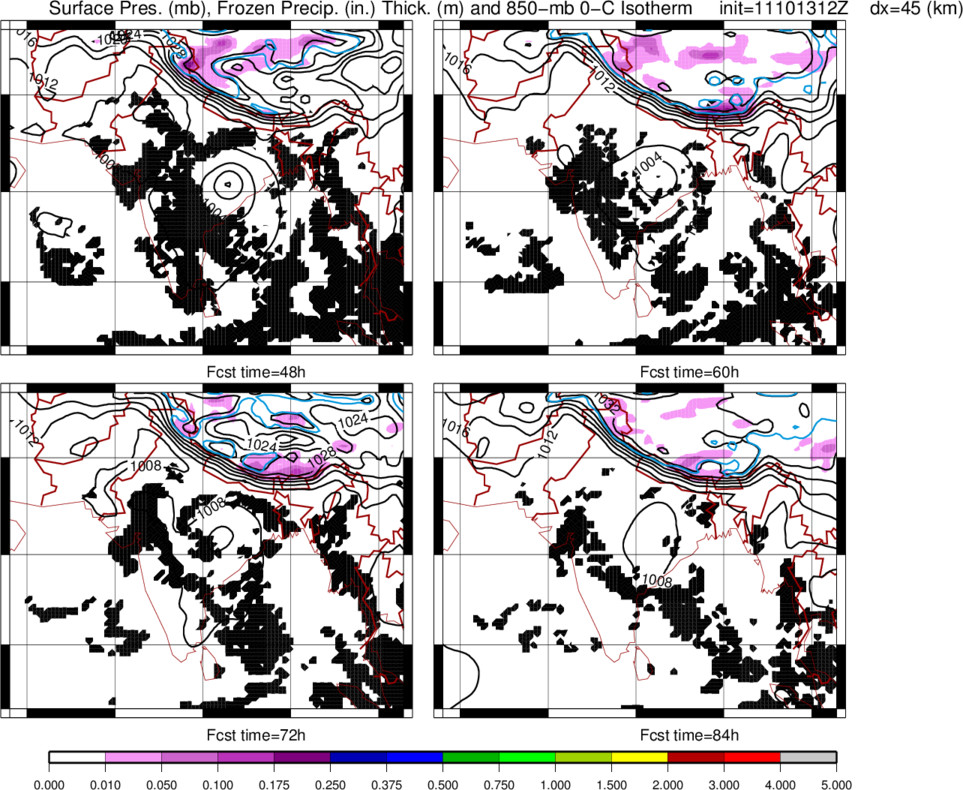
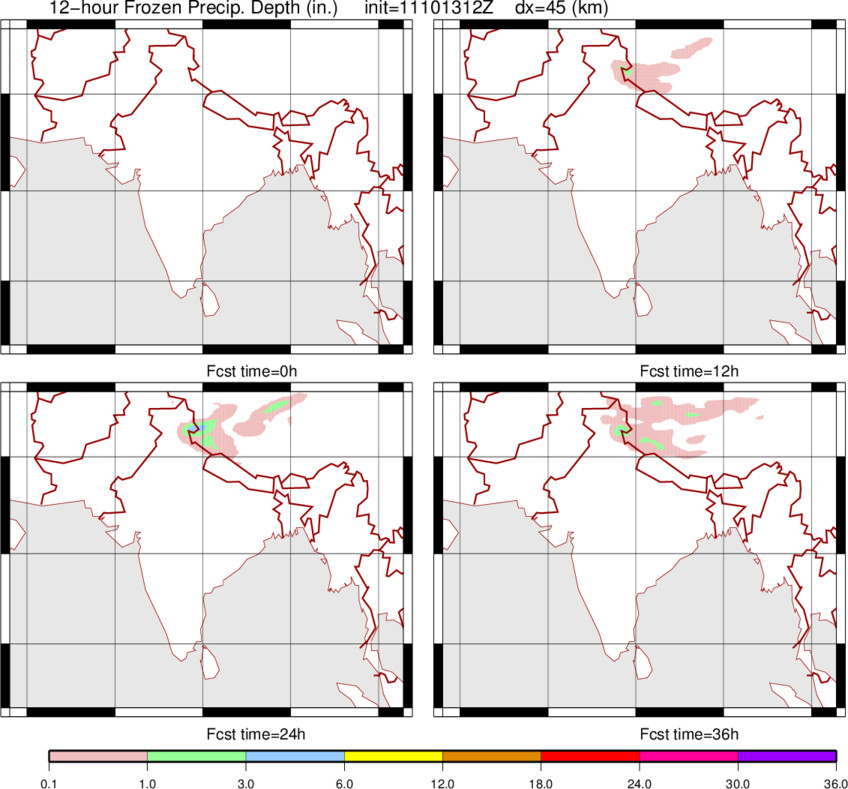
| PSurf, Froz Precip, 5400m Thck, 850mb-0deg |
0-36h |
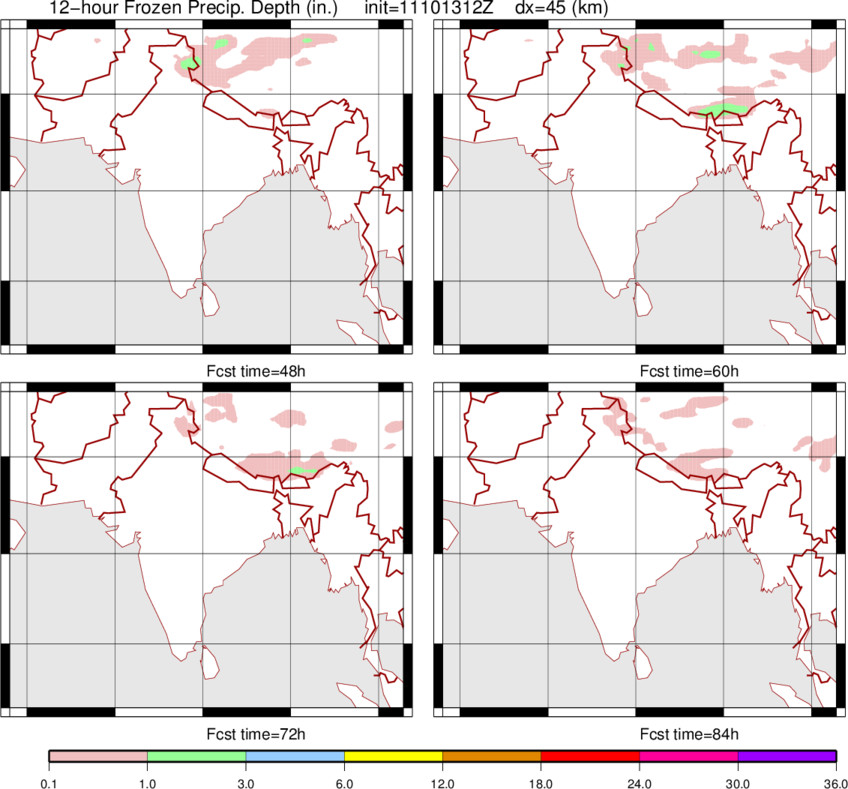
48-84h |
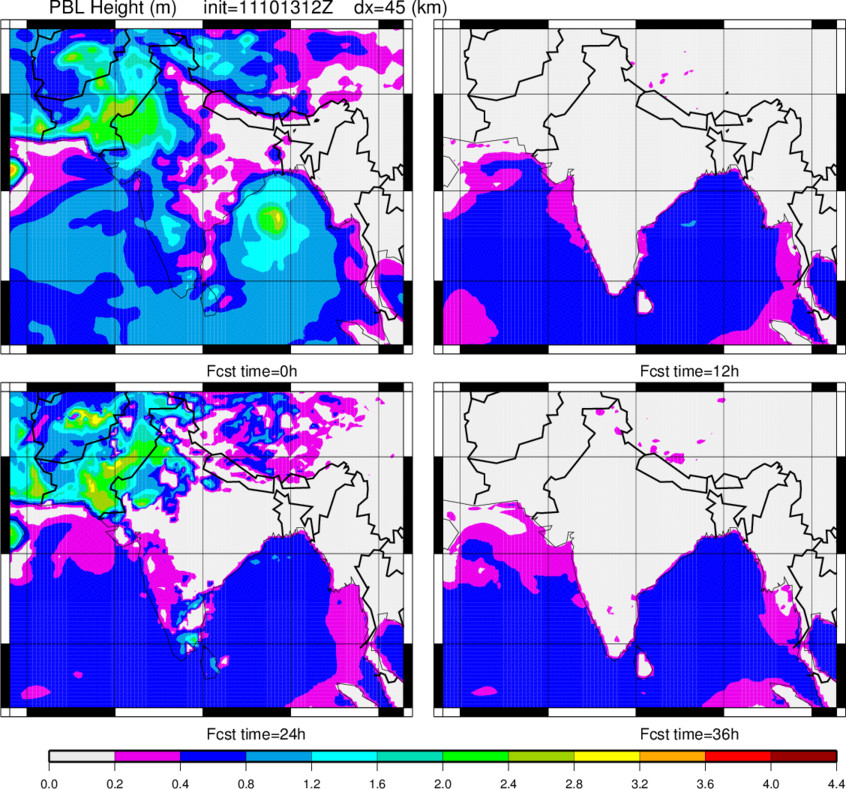
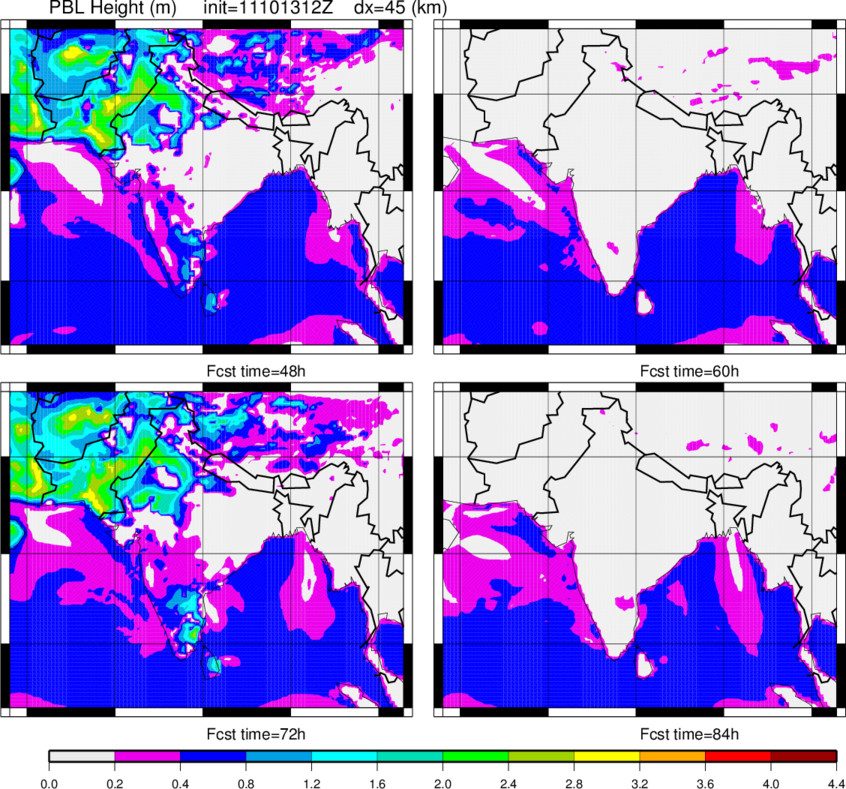
| PBLz |
0-36h |
48-84h |
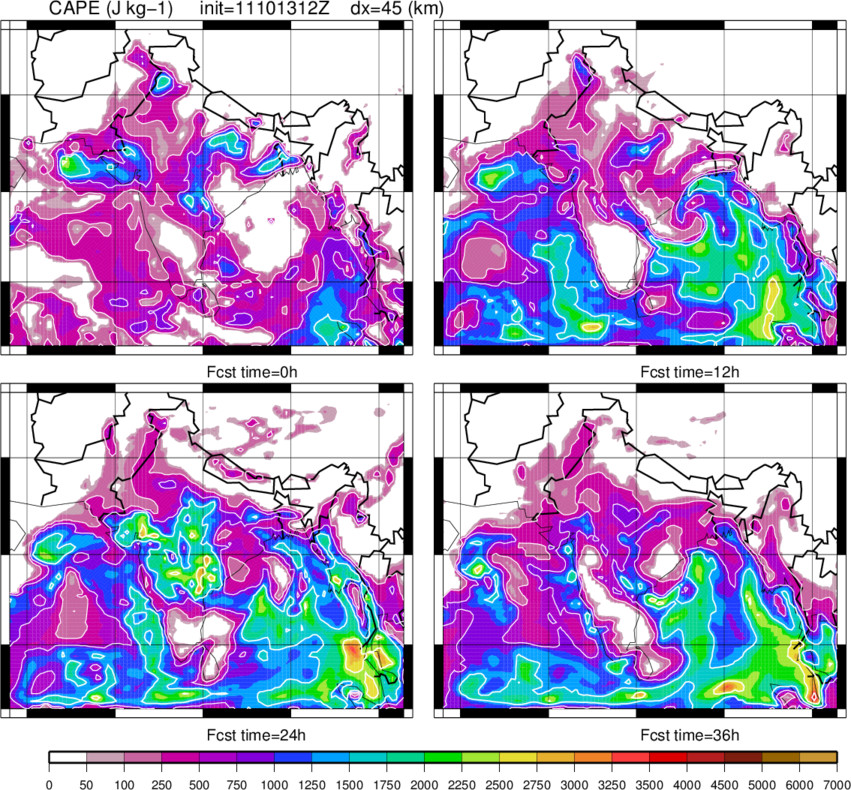
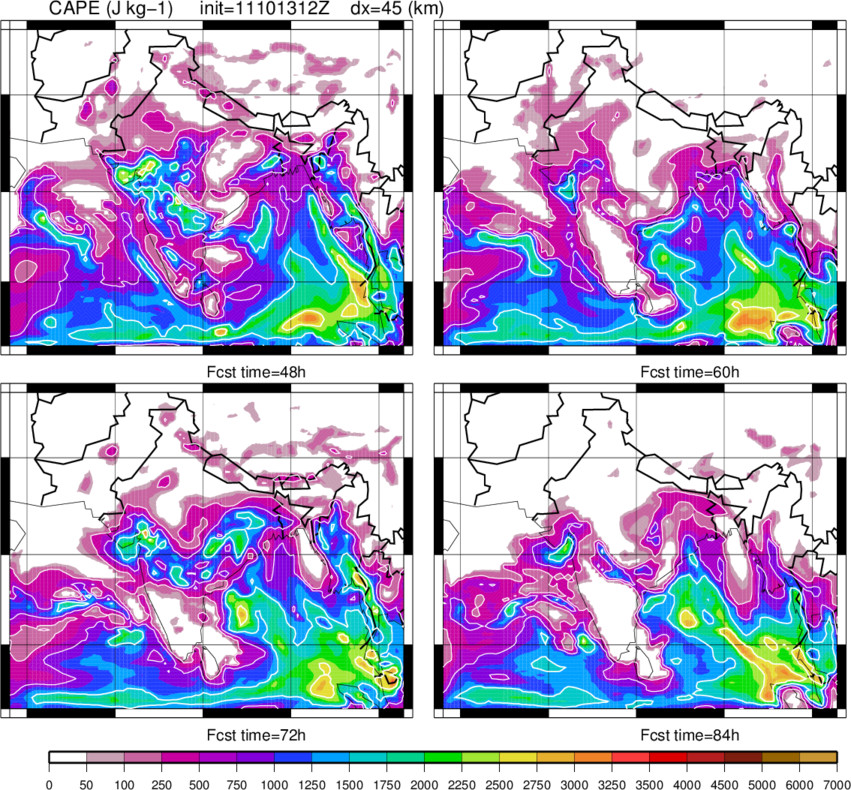
| CAPE |
0-36h |
48-84h |
| LIFTed Index |
0-36h |
48-84h |
| CIN |
0-36h |
48-84h |
| CMassFlx |
0-36h |
48-84h |
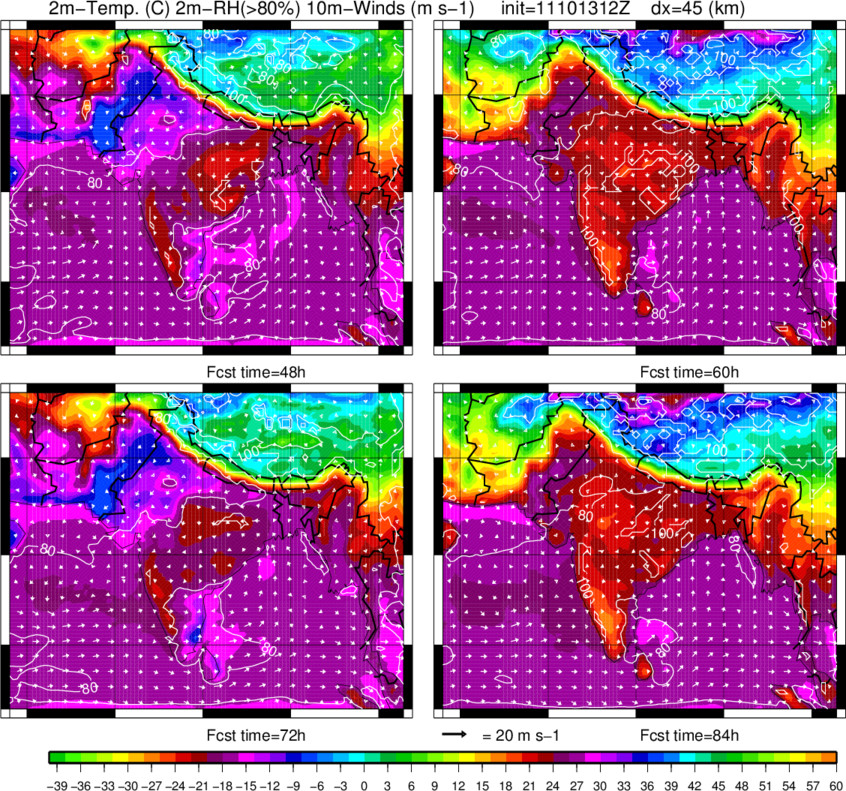
| Near surface (screen level) Tair (2 m) and WindV (10 m) |
0-36h |
48-84h |
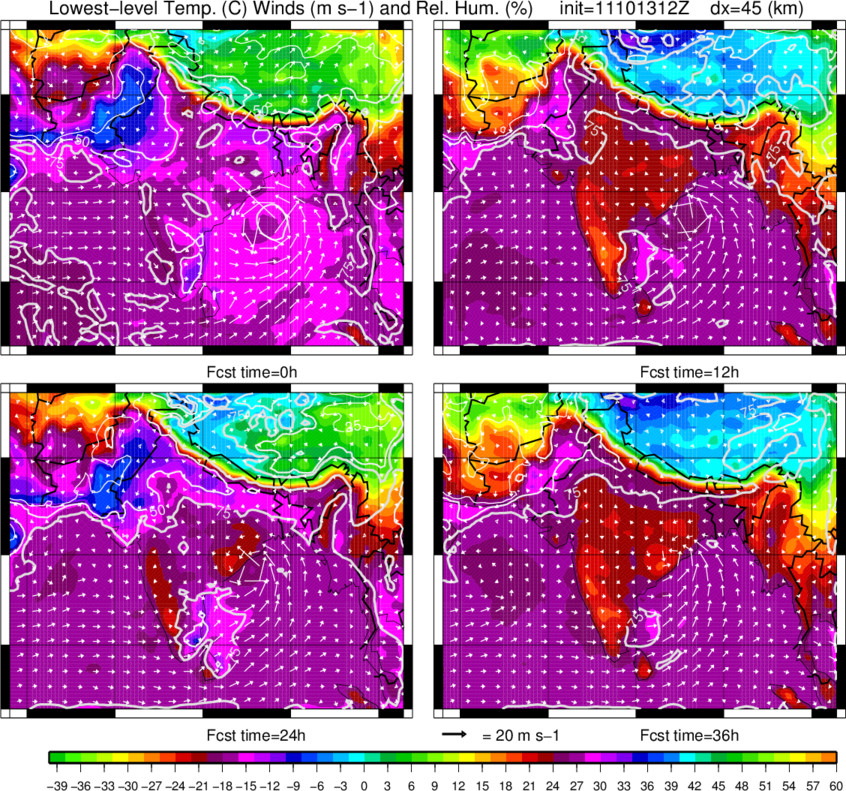
| Lowest model level Tair, and Wind and RH |
0-36h |
48-84h |
| Lowest model level Wind Speed |
0-36h |
48-84h |
| Lowest model level convergence |
0-36h |
48-84h |
Surface Variables:
|
|
|
| TSurf |
0-36h |
48-84h |
| Evapc (cummulative evaporation) |
0-36h |
48-84h |
| Qh (surface senbile heat flux) |
0-36h |
48-84h |
| Ql (surface latent heat flux) |
0-36h |
48-84h |
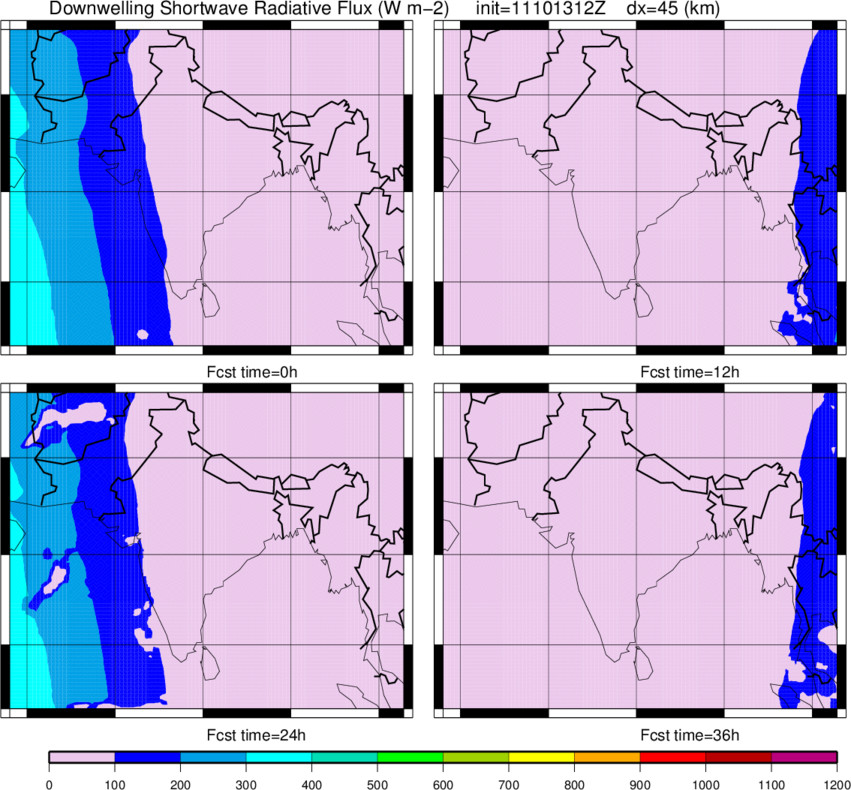
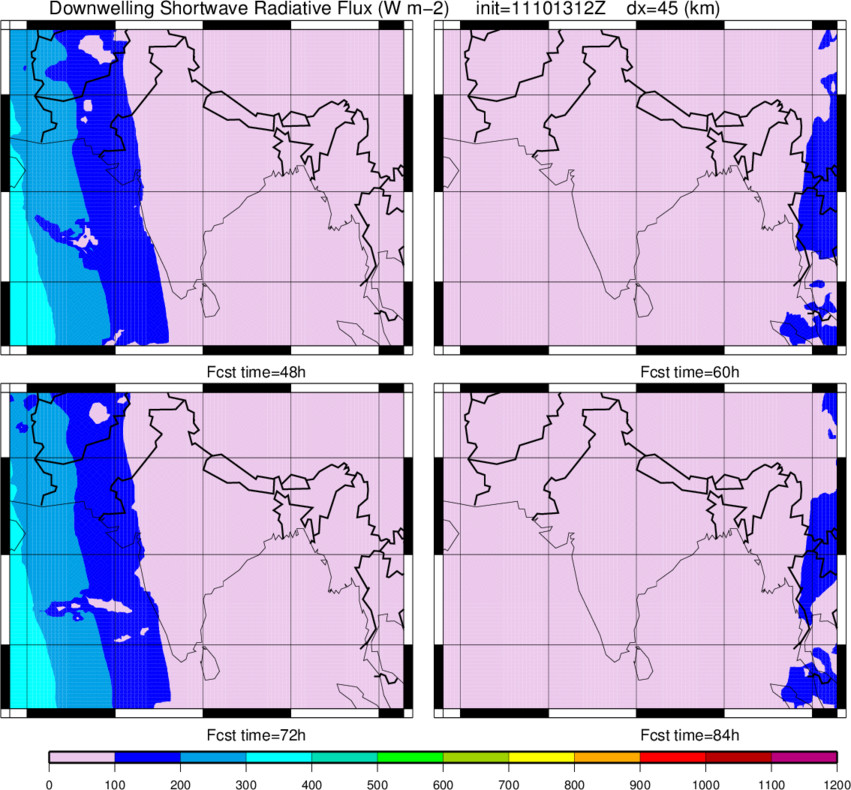
| SWdown |
0-36h |
48-84h |
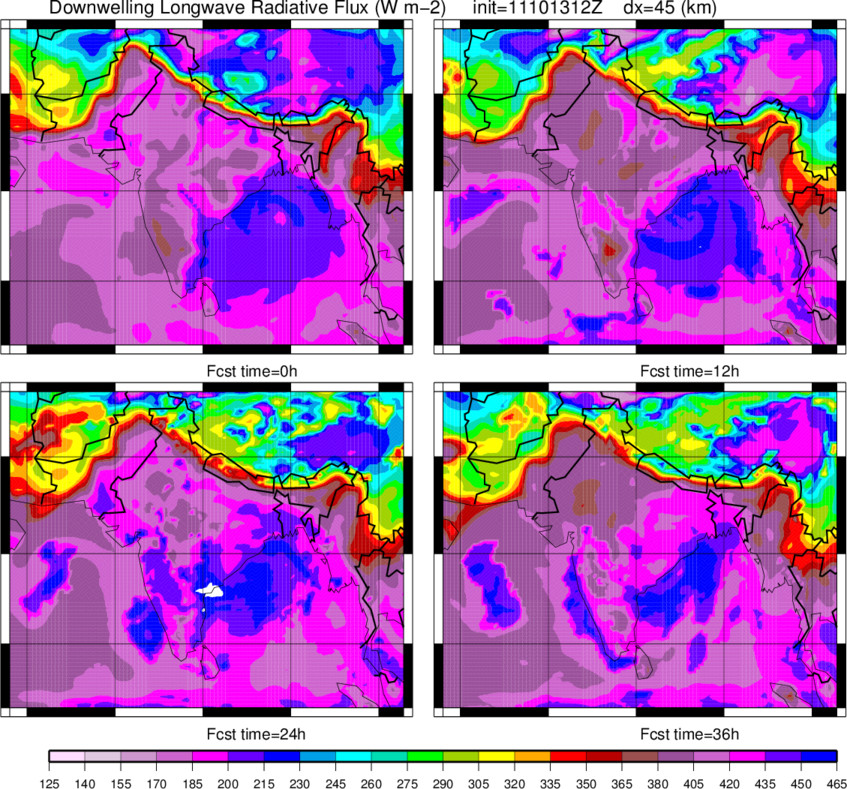
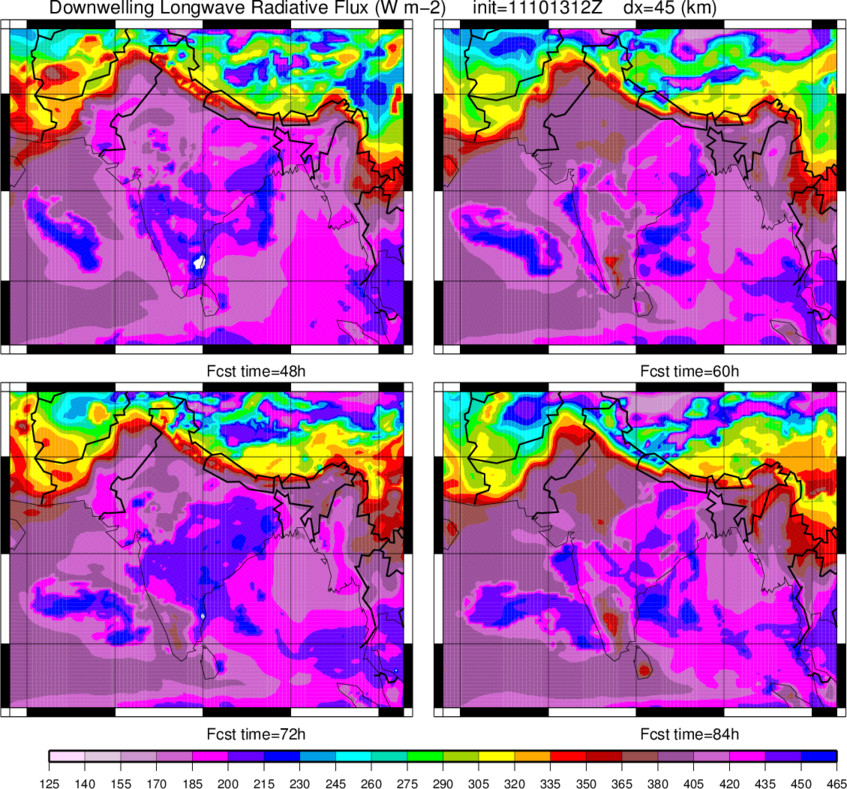
| LWdown |
0-36h |
48-84h |
| SnowF |
0-36h |
48-84h |
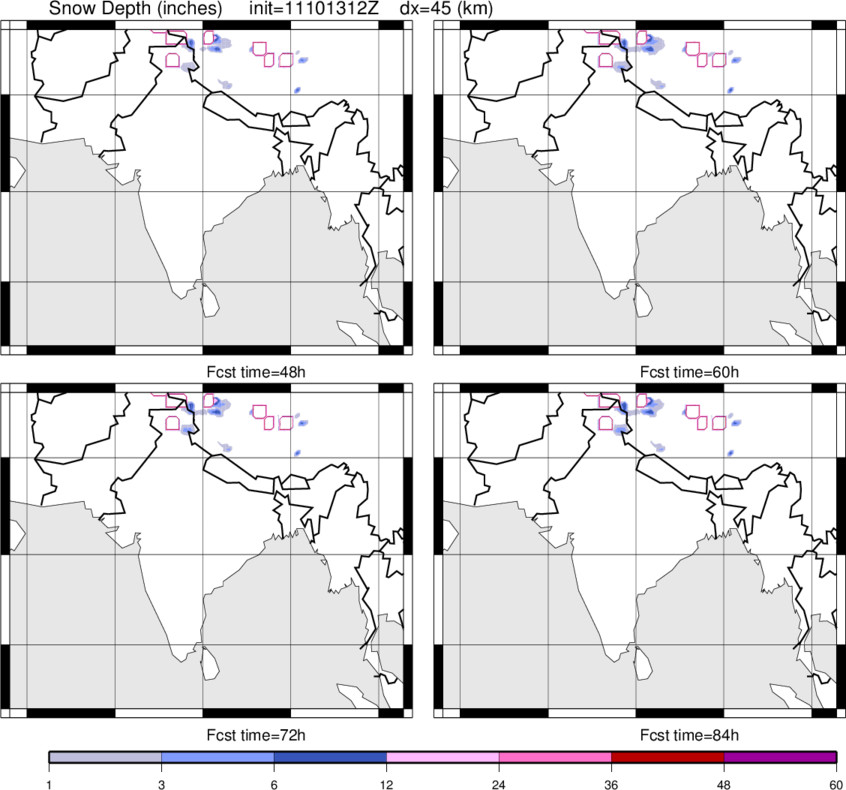
| SnowDepth |
0-36h |
48-84h |
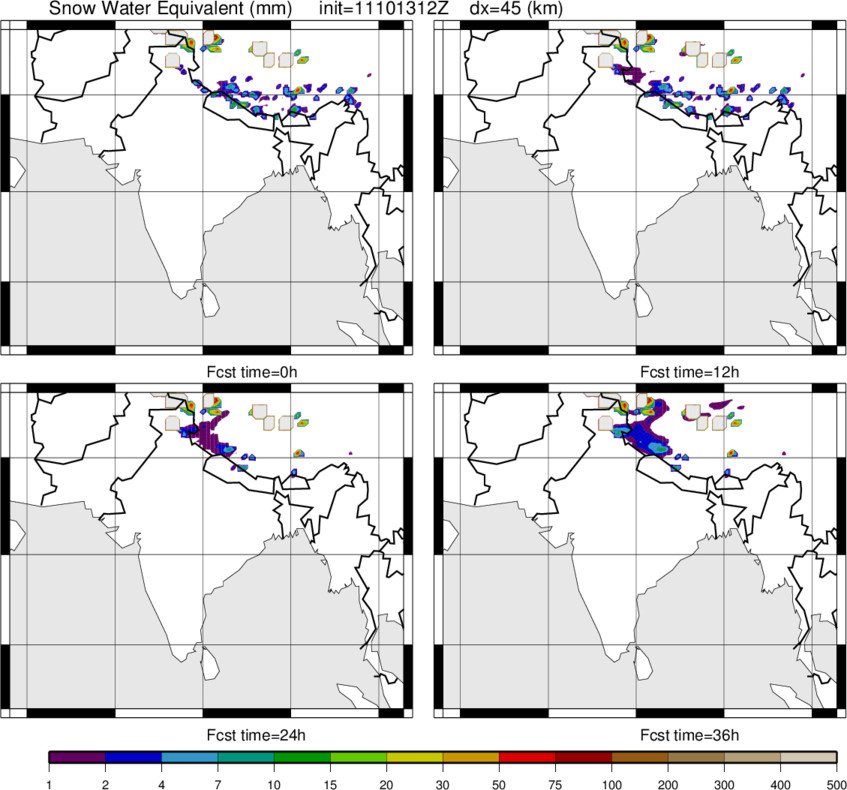
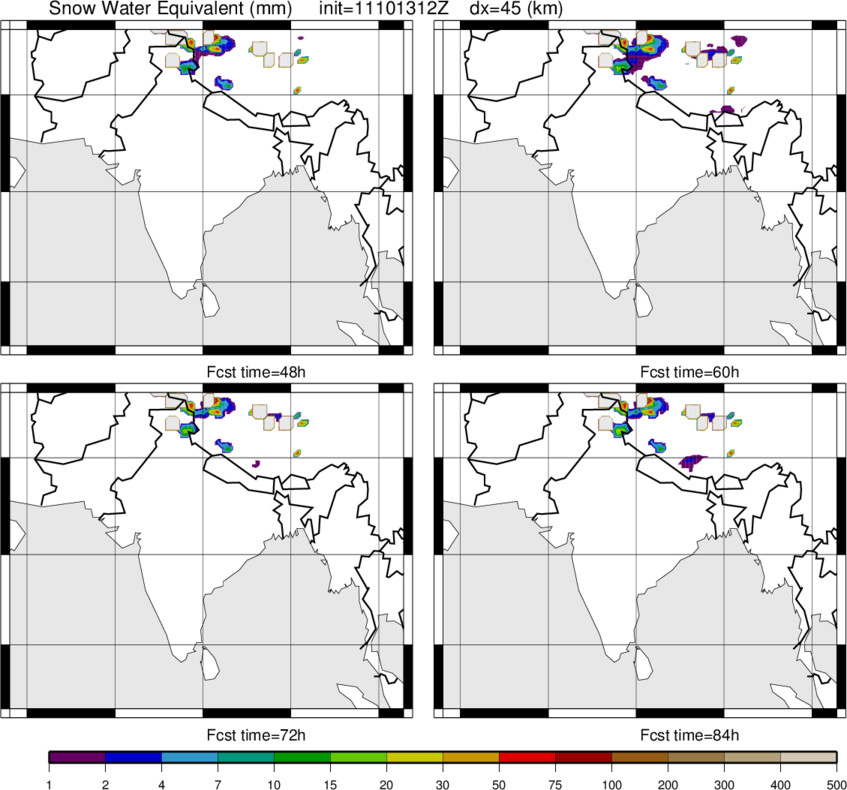
| Surface Snow Water Equivalent (SWE) |
0-36h |
48-84h |
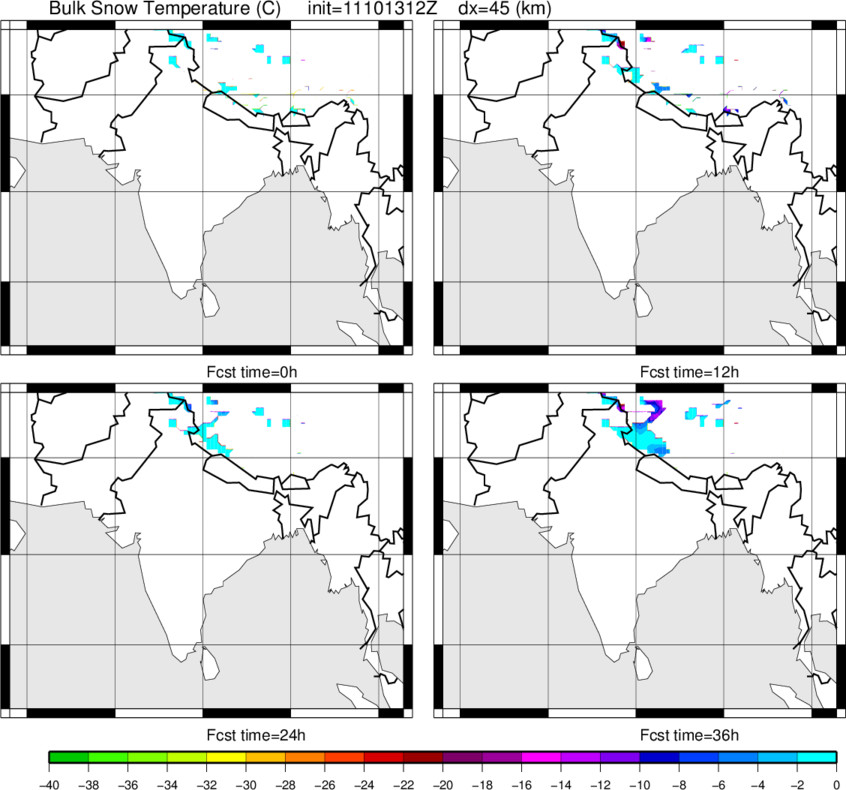
| Bulk Snow Temperature (on ground) |
0-36h |
48-84h |
| Bulk Snow Density (on ground) |
0-36h |
48-84h |
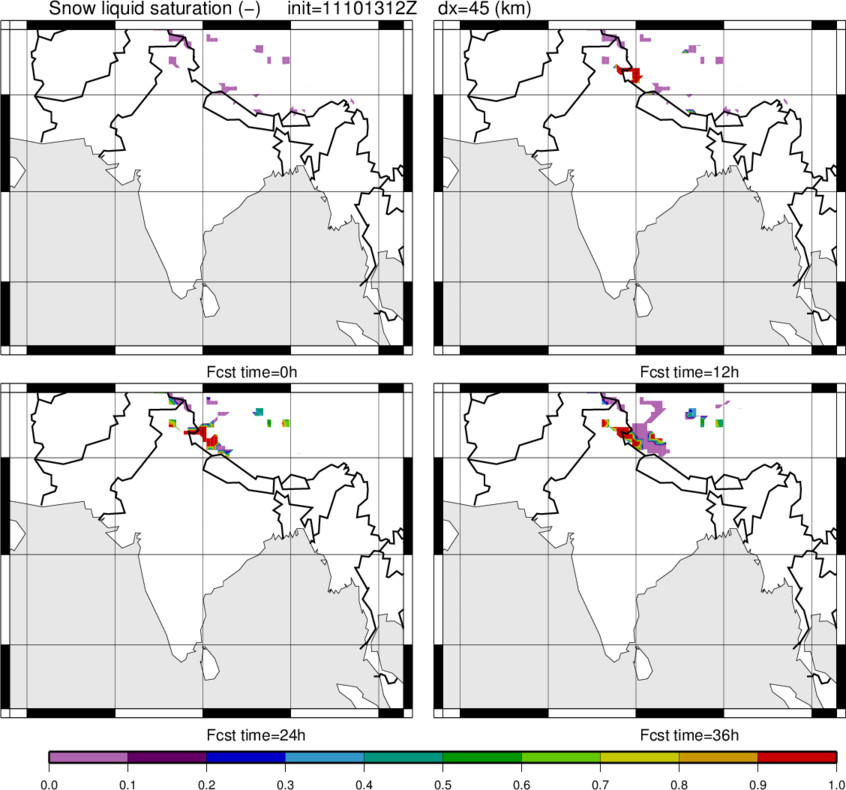
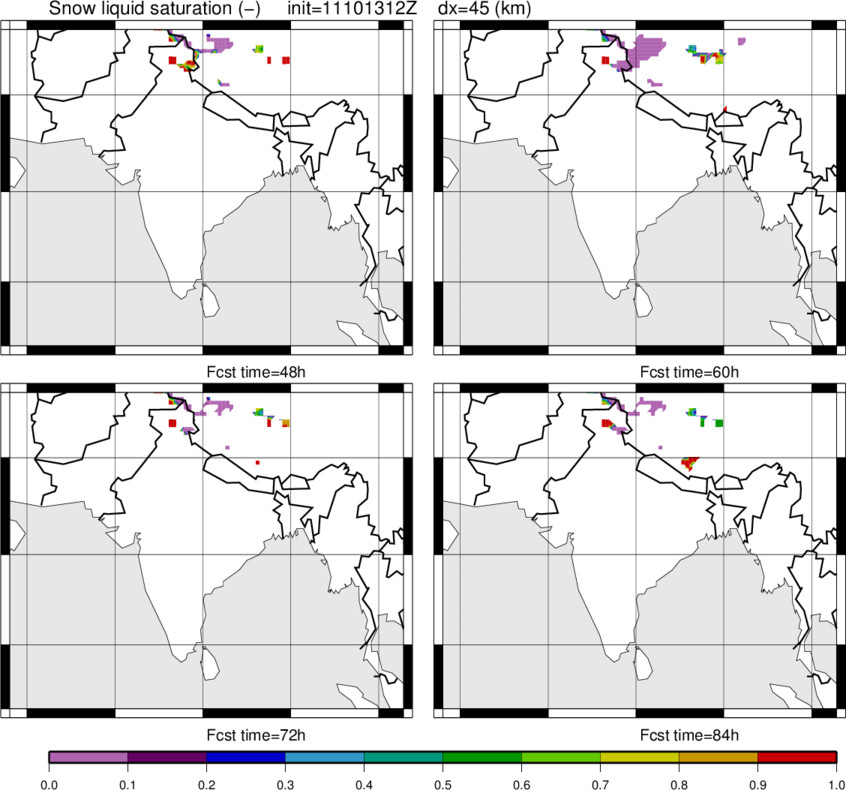
| Snow Saturation (on ground) |
0-36h |
48-84h |
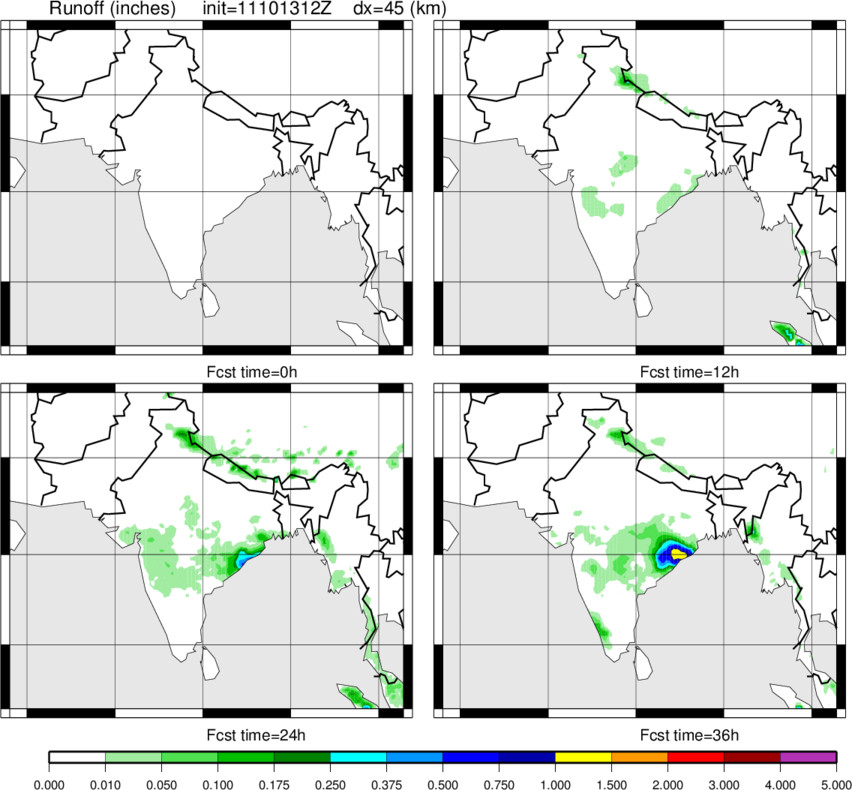
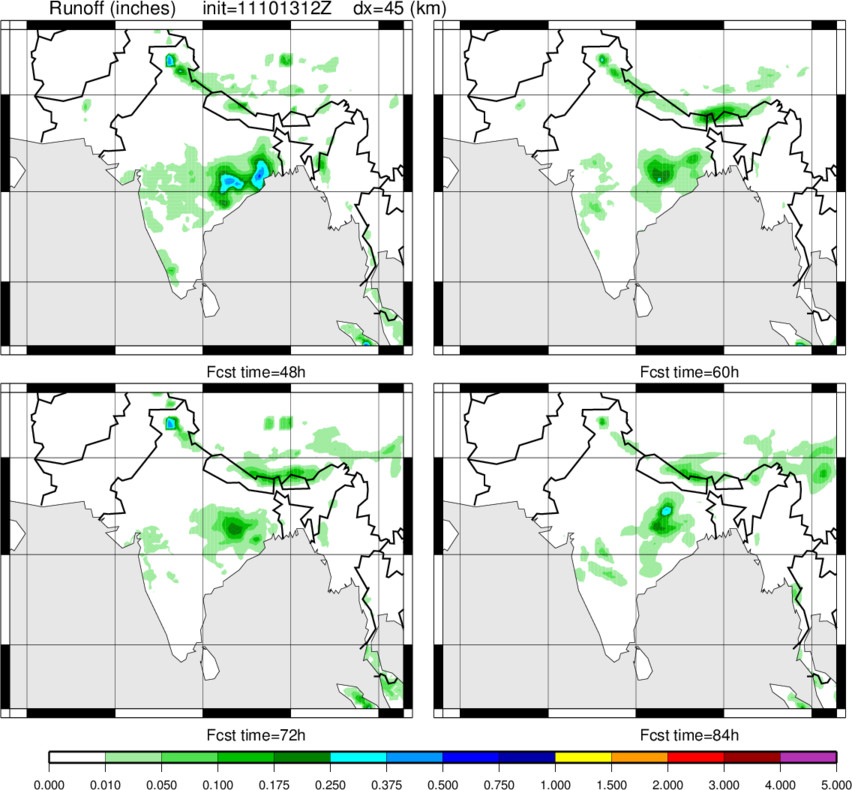
| Total Runoff |
0-36h |
48-84h |
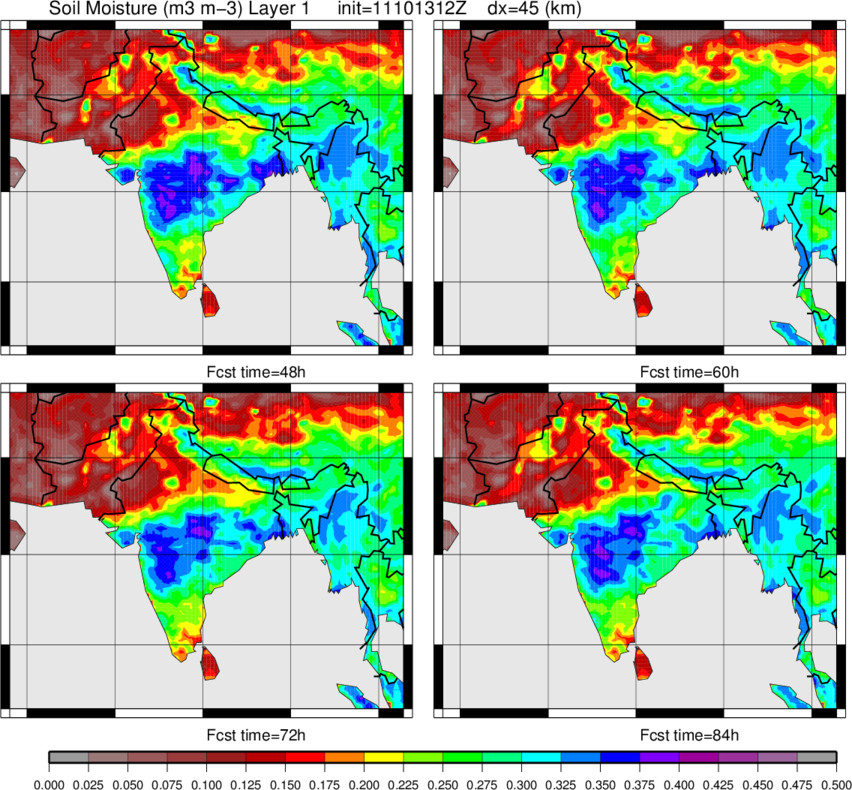
| Soil Moisture: layer 1 (0.00 to 0.03 m) |
0-36h |
48-84h |
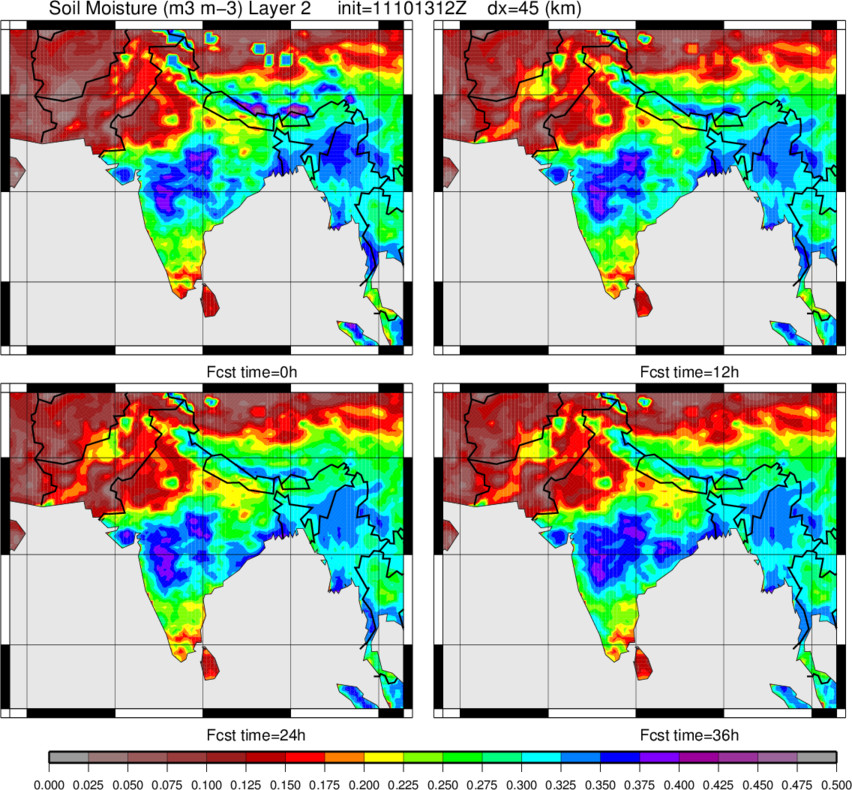
| Soil Moisture: layer 2 (0.03 to 0.10 m) |
0-36h |
48-84h |
| Soil Moisture: layer 3 (0.10 to 0.40 m) |
0-36h |
48-84h |
| Soil Moisture: layer 4 (0.40 to 1.00 m) |
0-36h |
48-84h |
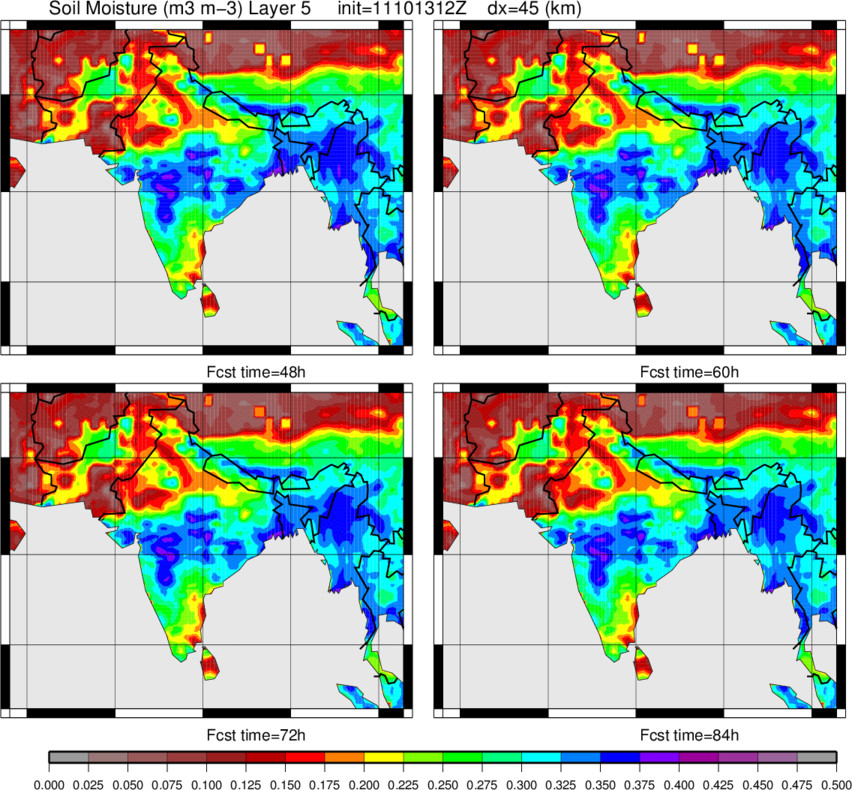
| Soil Moisture: layer 5 (1.00 to 2.00 m) |
0-36h |
48-84h |
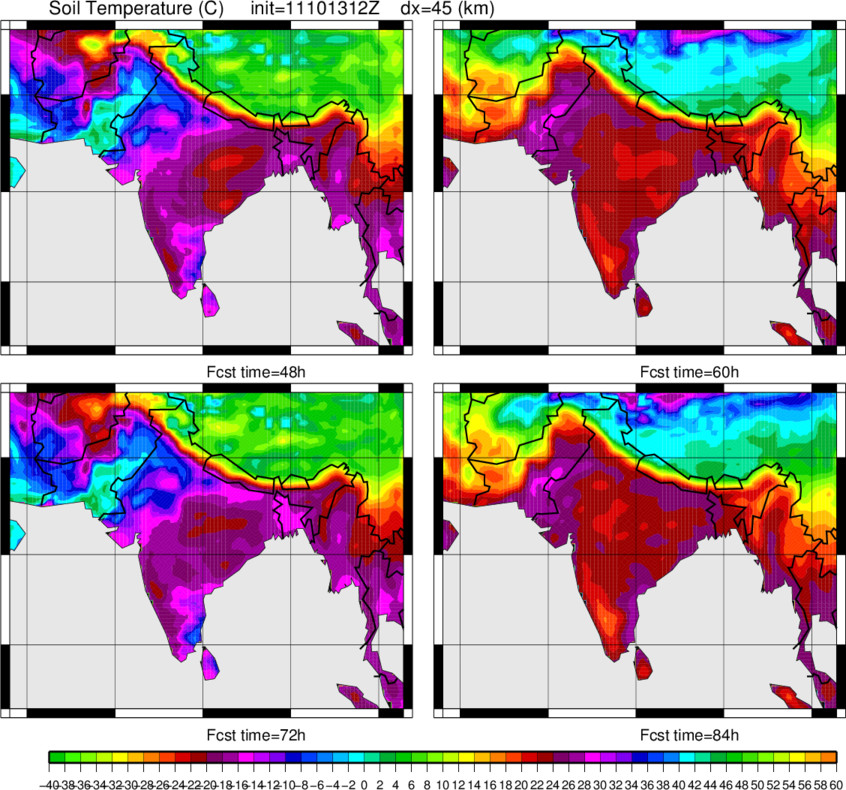
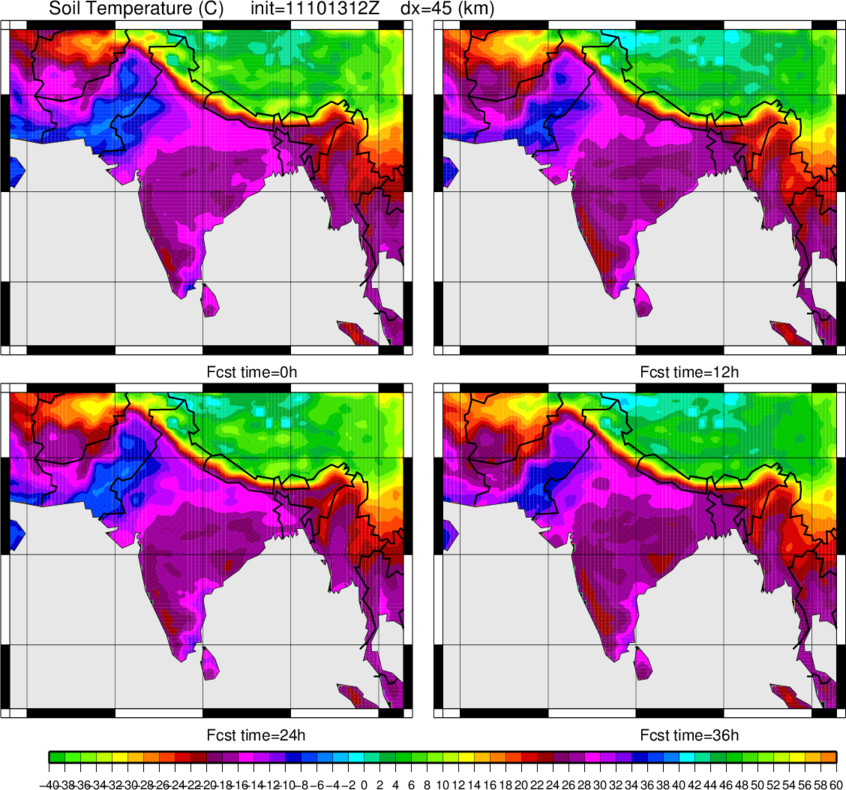
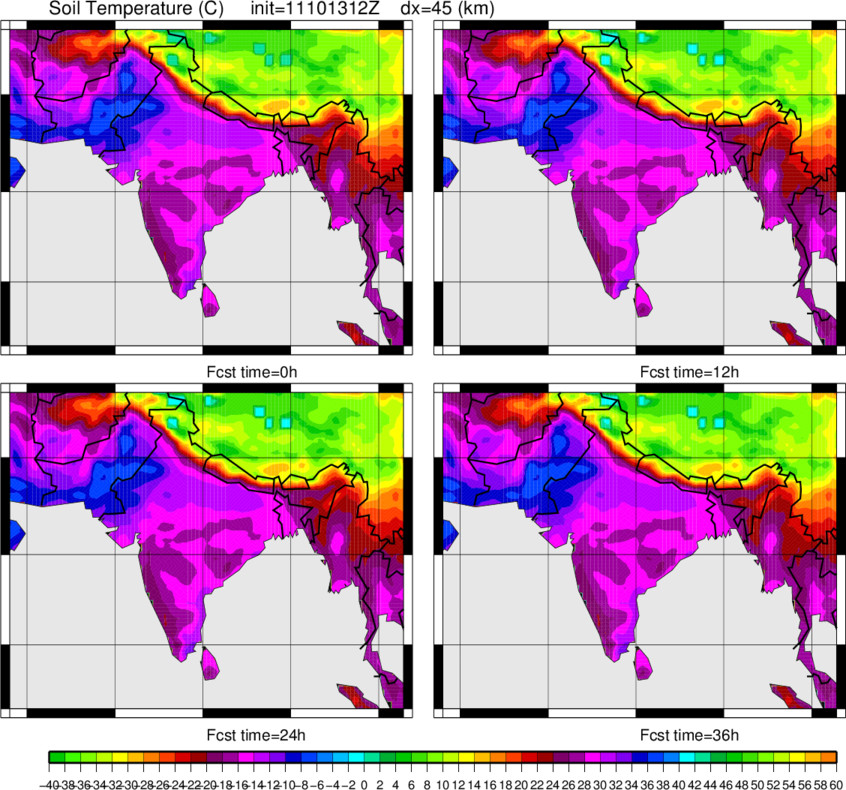
| Soil Temperature: layer 1 (0.00 to 0.03 m) |
0-36h |
48-84h |
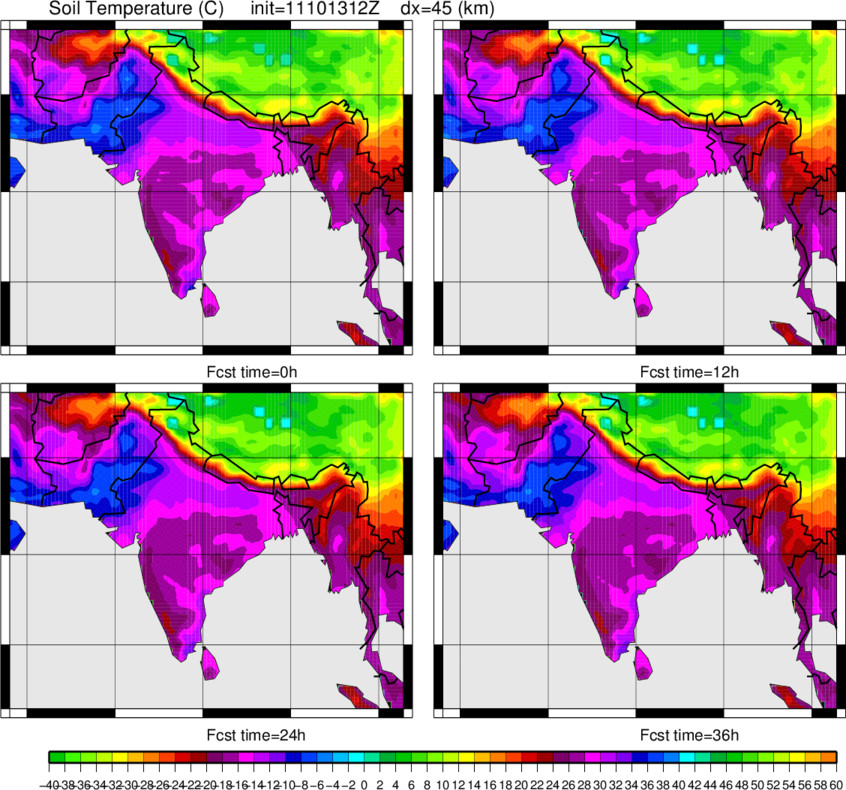
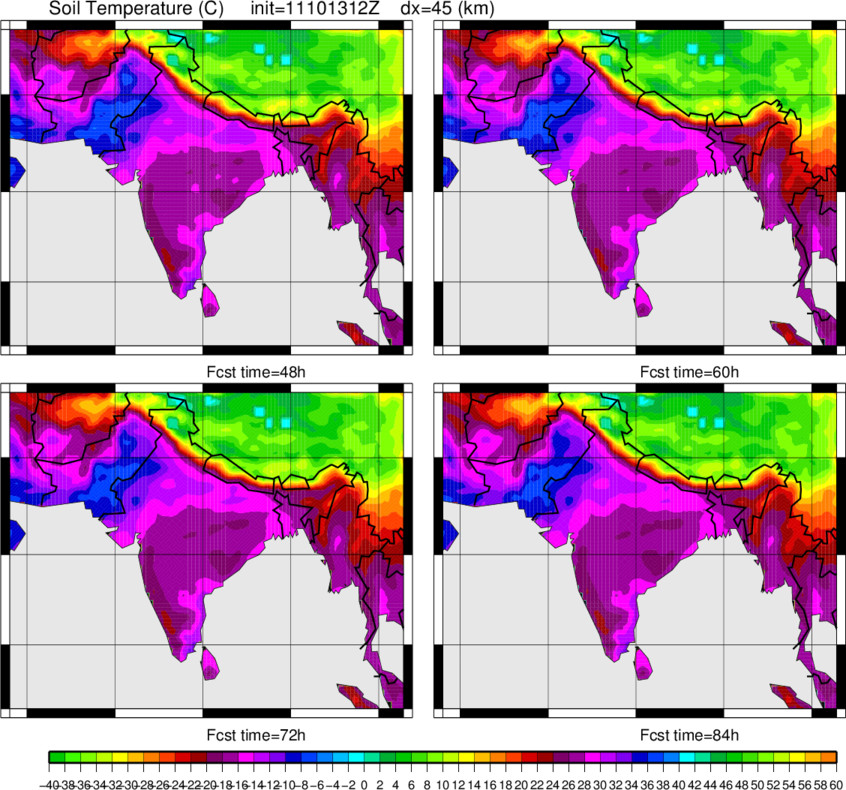
| Soil Temperature: layer 2 (0.03 to 0.10 m) |
0-36h |
48-84h |
| Soil Temperature: layer 3 (0.10 to 0.40 m) |
0-36h |
48-84h |
| Soil Temperature: layer 4 (0.40 to 1.00 m) |
0-36h |
48-84h |
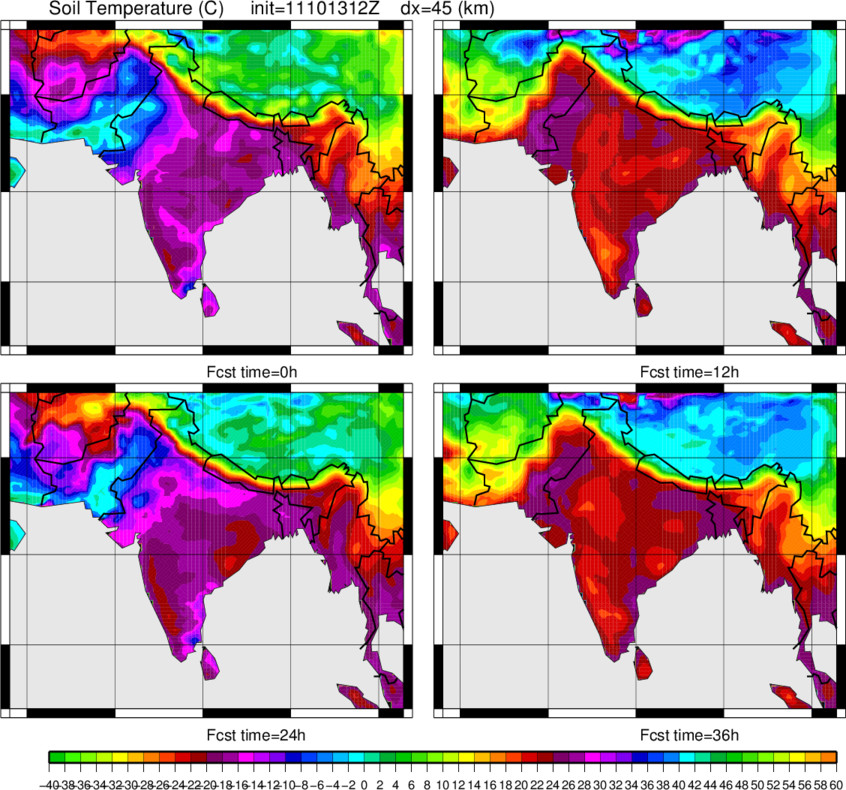
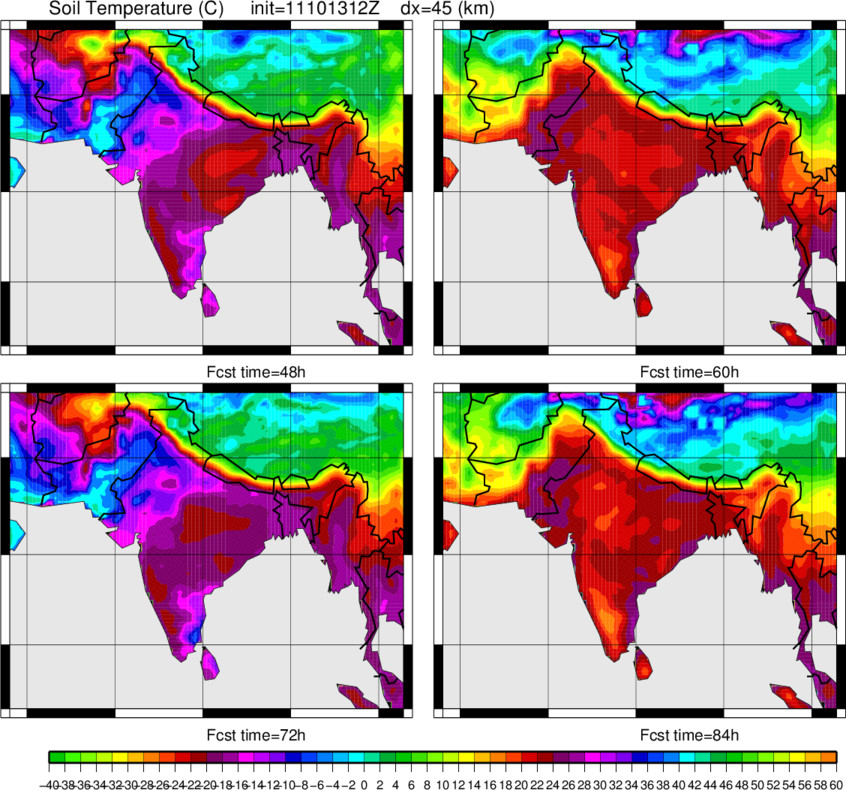
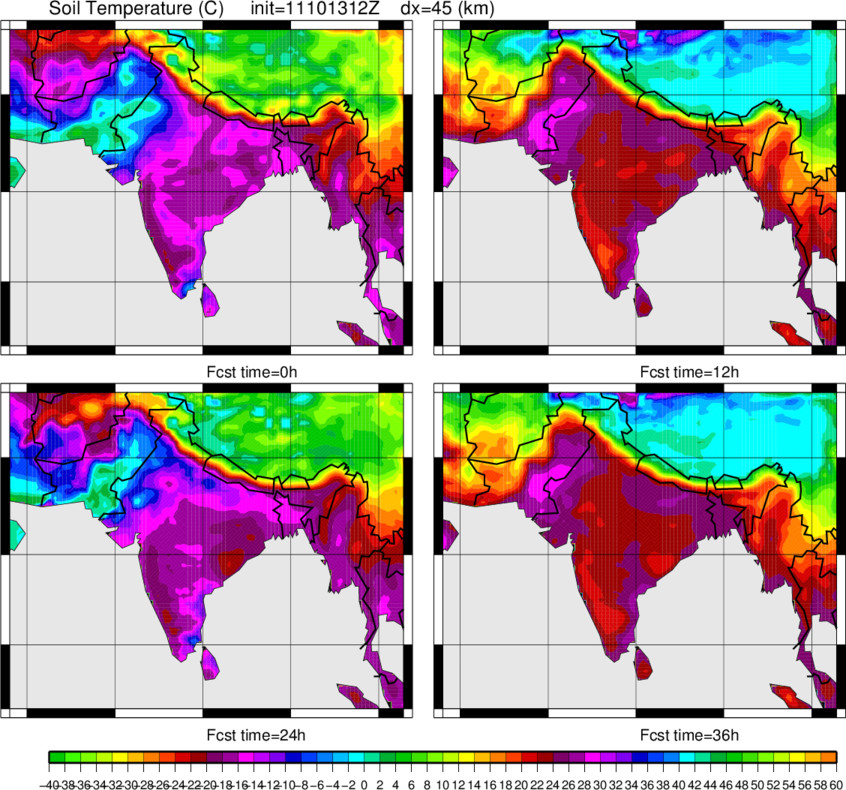
| Soil Temperature: layer 5 (1.00 to 2.00 m) |
0-36h |
48-84h |
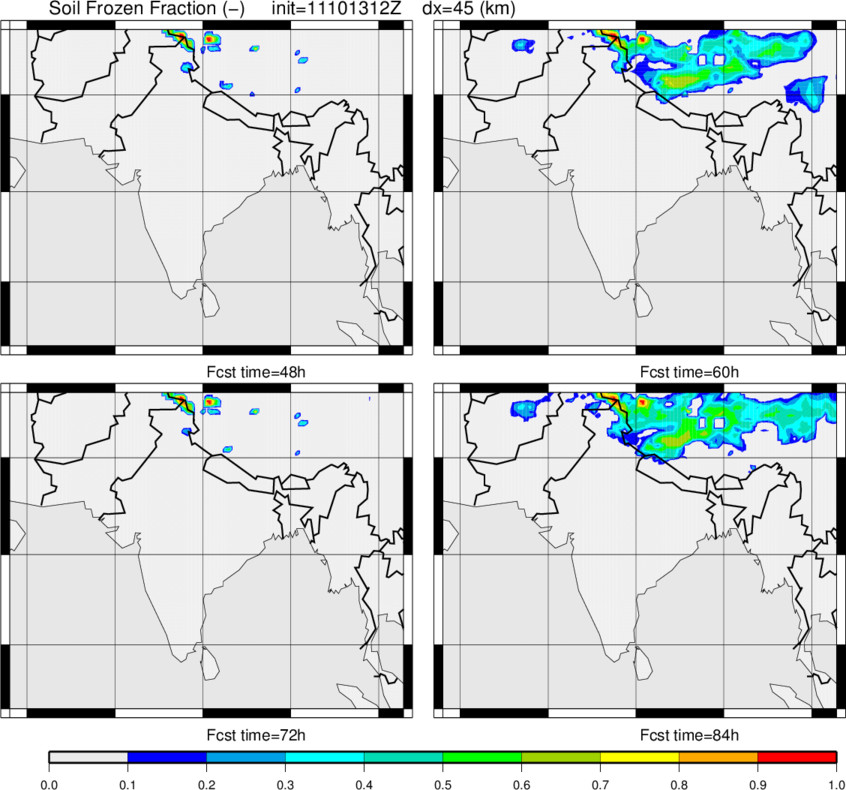
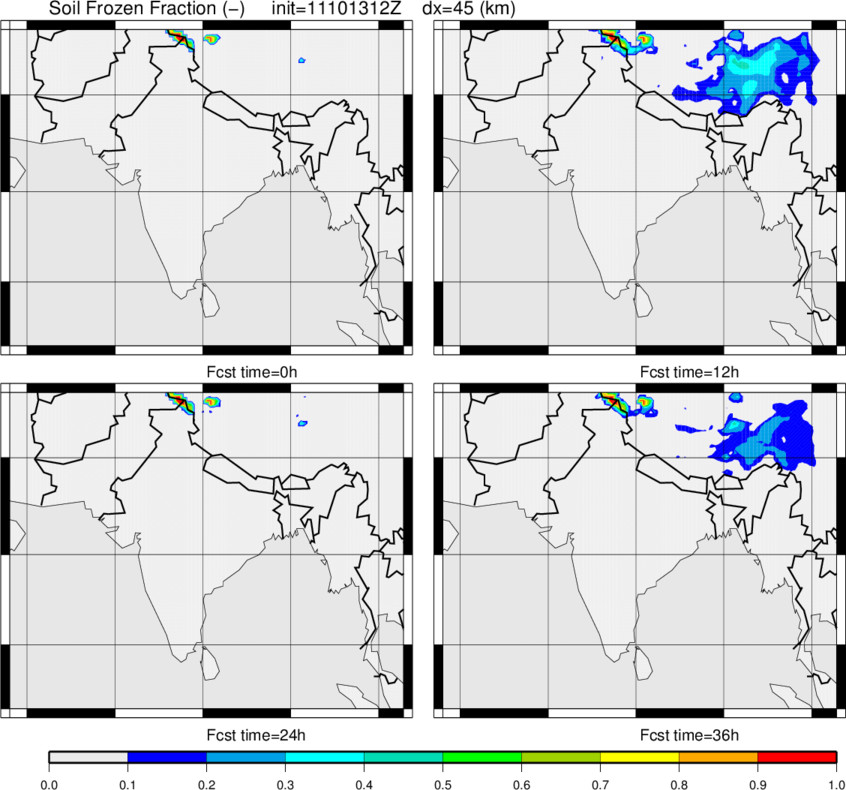
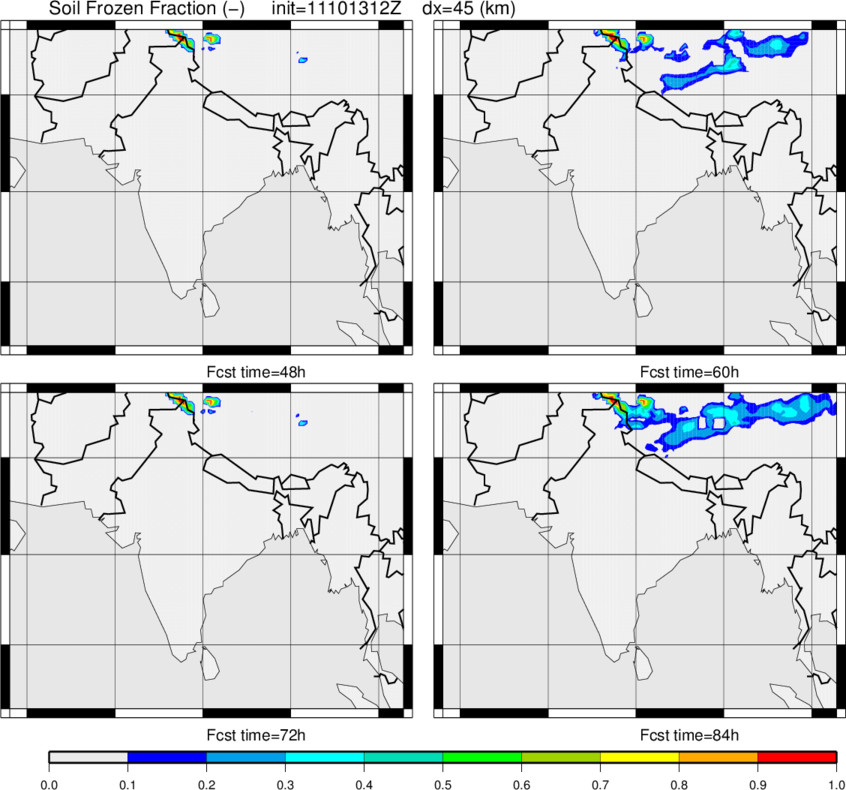
| Frozen Soil: layer 1 (0.00 to 0.03 m) |
0-36h |
48-84h |
| Frozen Soil: layer 2 (0.03 to 0.10 m) |
0-36h |
48-84h |
| Frozen Soil: layer 3 (0.10 to 0.40 m) |
0-36h |
48-84h |
| Frozen Soil: layer 4 (0.40 to 1.00 m) |
0-36h |
48-84h |
| Frozen Soil: layer 5 (1.00 to 2.00 m) |
0-36h |
48-84h |
Key:
- Hgt = Geopotential Height (m)
- WindS = Wind speed
- WindV = Wind vectors
- Tair = Air Temperture
- AbsVort = Absolute Vorticity
- VVel = Vertical velocity defined as -omega (+
for upward motion)
- Qair = Specific Humidity
- Precip = Cummulative total (convective and
stratiform) Precipitation for
each forecast interval
- Convct Precip = Cummulative convective
Precipitation for each forecast interval
- Convct Precip Frac = Ratio of Cummulative
convective to total precipitation for each forecast interval
- Froz Precip = Cummulative Frozen total Precipitation
(liquid water equivalent)
- Precipitable Water = Total vertically integrated
water vapor (inches)
- Thck = Pressure thickness
- High level Clouds = Clouds above
approximately 400 mb (standard atmosphere)
- Medium level Clouds = Clouds between
approximately 800 and 400 mb (standard atmosphere)
- Low level Clouds = Clouds below
approximately 800 mb (standard atmosphere)
- 850mb-0deg = 850mb 0 degree C isotherm
- Lowest Model Level = Currently corresponds
to eta=0.997 or
about 30 m above the ground (less in high altitude zones)
- Near-Surf = 2m Tair and 10m Wind speed (i.e. at
the level of standard measurements)
- Evapc = Cummulative Surface evaporation (mm day-1 over
forecast interval)
- TSurf = Surface temperature: combined surface
vegetation and upper thin soil layer or SST
(Sea Surface Temp.)
- SWdown = downwelling shortwave radiation flux
at the surface (W m2)
- LWdown = downwelling longwave radiation flux
at the surface (W m2)
- PBLz = Planetary Boundary Layer Depth
(thickness: distance from top of PBL to surface) (m)
- CAPE = Convective Available Potential Energy (J kg-1)
- CIN = Convective Inhibition (J
kg-1)
- CMassFlx = Convective mass flux (+up):
maximum mass flux upward (multiplied by normalized mass
flux profile to obtain mass flux (up) profile)
- SnowF = Cummulative snowfall depth (inches) for each forecast interval
- SnowDepth = Snow depth (inches) on the ground
- SWE = Snow Water Equivalent depth (mm) on the ground
- Snow Density = Bulk Snow density (kg m-3) on
the ground
- Snow Saturation = snow liquid water
saturation (on the ground)
- Snow Temperature = Bulk Snow Temperature (K) on the ground
- Runoff = Cummulative Total runoff (and
drainage) for each forecast interval
- Soil Moisture = layer average volumetric
water content (m3/m3)
- Soil Temperature = layer average soil
temperature (C)
- Frozen Soil = layer average Fraction of total water content
which is ice (-),
ranges from 0 to 1 (totally frozen)
* NOTE on the 850 mb 0-C Isotherm - the 850 mb air temperature is replaced by the
lowest level atmospheric temperature if the corresponding
pressure is below 850 mb. This is more relevant in
mountainous terrain.
** NOTE on the snow plots: this plot is made simply by
assuming a 12-1 ratio between snow fall depth
(Snowf) and the liquid
water equivalent snowfall depth. It simply represents the
potential depth of snowfall (precipitation thickness),
and does not consider snowpack processes such as compaction or melting of snowpack
(snowpack physics), nor a variable snowfall density.
SnowDepth corresponds to the actual depth of the snowpack
on the surface, and it
changes in time owing to compaction, settling, sublimation, melting,
and accumulation.
*** NOTE on the Runoff plot: it is the sum of
all water leaving the soil column, and consists in
sub-grid surface (fast response) Dunne runoff, deep-soil
drainage, and any excess saturation. In this simple
representation, it is assumed to either flow laterally to
nearest river, or to flow to deeper soil reservoirs/aquifers.
ASP-GFS Comparison Plots
Comparison plots (500 mb Height and Surface Pressure)
which show the forecasts for both ASP and the GFS model
are plotted for the
Floater Domain
for the same forecast increments (and both starting at the same time using the same GFS analysis
fields for initialization). Note that the plotted GFS fields are those interpolated
from the original GFS global fields, so some very small differences between these
fields and those presented, for example, on the NCEP-GFS site are posible. Finally,
note that these are not validation plots (they are
comparison plots), as the GFS data plotted are forecast
data.
Standard Atmosphere: Pressure-Height correspondence
As a reference, the pressure levels above correspond to
the approximate heights
below in meters (and feet) for a
standard
atmosphere.
This can be used as a rough estimate of the height of the
dust plumes shown in the plots above.
| Pressure (HPa or mb) | height (meters) | height (feet) |
| 100 | 16170 | 53051 |
| 200 | 11770 | 38616 |
| 300 | 9160 | 30053 |
| 500 | 5570 | 18274 |
| 700 | 3000 | 9843 |
| 850 | 1460 | 4790 |
| 925 | 760 | 2493 |
| 1013.25 | 0 | 0 |
Please send any comments to aaron.a.boone@gmail.com
Disclaimer
Please note that this page has nothing to do with
my employer, CNRS, or where I am employed, at the National
Center for Meteorological Research (Centre National de
Recherches Meteorologiques: CNRM) at Meteo-France.
The opinions expressed herein are my own, and are not a
reflection of those where I work or of my employer.
Acknowledgement
Finally, a special thanks is extended to the United States
National Centers for Environmental Prediction (NCEP)
for making
GFS analysis and forecast data freely available in near real time,
which makes applications and research such as this possible.
|


