Overview of the Application
This page presents the real-time simulations of a passive tracer using the
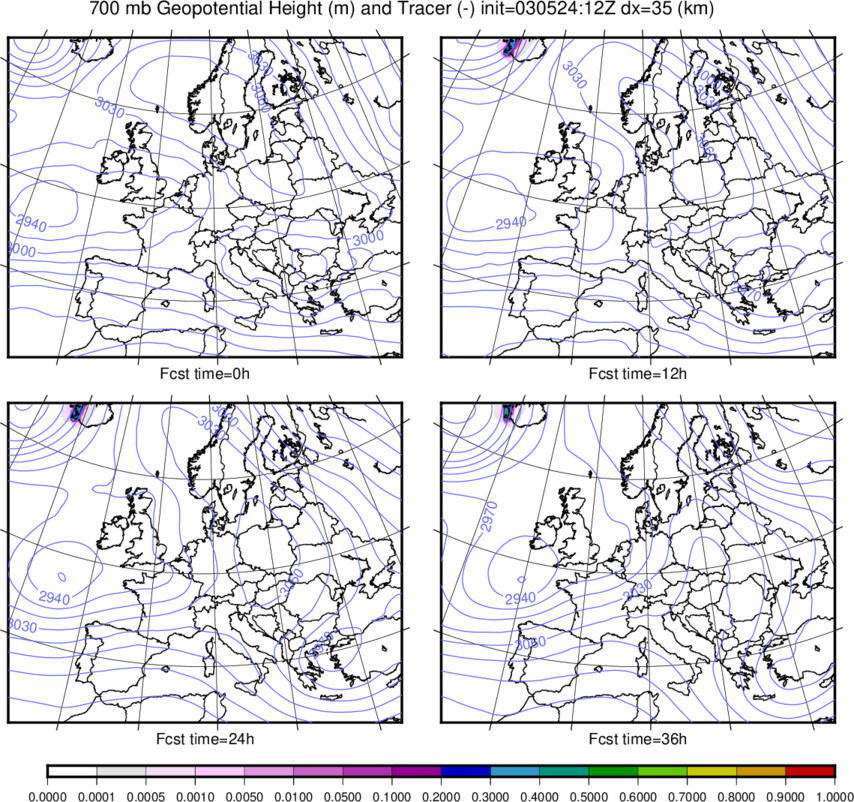
ASP model. A very simple representation of volcanic dust is used as the tracer.
Forecasts go out to 3 1/2 days, and are run once a day starting at 12 UTC
(or sometimes twice a day at 0 UTC also).
A single-point (within 1 grid box) volcanic dust source is simulated for a possible volcano
in this application.
How the dust transport is simulated
Volcanic dust is represented as a unit passive tracer prognostic variable in the
model. Unit means that the tracer concentration is
normalized (varies from 0 to 1). The tracer
is passive in the sense that it has no impact on the atmospheric radiation,
land surface, clouds, etc. The tracer (here
representing volcanic dust) is transported by the model
predicted vertical and horizontal wind components and is
vertically mixed and transported by the atmospheric
turbulence parameterization. Horizontal diffusion uses the
same method/option for the tracer as for the other
model scalars. Very simple parametrizations for dry deposition (simply assuming
a maximum lifetime of dust of several weeks) and washout
by stratiform and deep-convective rainfall are used. The effects of shallow convection and
convection due to conditional instability on vertical transport
are modelled within the turbulence scheme.
A single source corresponding to the grid box containing
the volcano is simulated here,
although it should be noted that one or multiple sources can be simulated
anywhere within the domain.
The dust forcing is currently quite simple: a relaxation towards the maximum
tracer concentration is performed only for the volcano (source) grid box,
extending from the lowest atmospheric model layer up to about 40,000 feet.
The forcing is constant during the forecast period (since
predicting fluctations in dust fluxes from the volcano to
a reasonable accuracy is currently not possible, or at
least, is not straightforward to model herein).
The tracer here is represented as a unit or normalized
tracer:
values range from 0 to 1.
This is quite simple, but this representation is used
because the true atmospheric dust concentration is
currently not known very well. The goal of this application is simply to show
where the dust cloud (at different vertical levels) would flow given the ASP
forecast wind and atmospheric conditions. The dust fields are initialized
using the previous ASP forecast (6 hours before the current forecast base time)
with a simple data assimilation scheme (for the atmospheric prognostic variables)
to get a dust field which is consistent
(as much as possible) with the current analysis when the forecast begins.
(for more details on the simple assimilation scheme, see the main
ASP page).
There is also an option to begin with no initial dust concentration.
The atmospheric and surface initial conditions for the
atmospheric and surface modules of the model are based on the
analysis from the NCEP-GFS operational global model forecast system, and lateral
boundary forcing is provided by
GFS forecasts.
For details on ASP dynamics, see the Model Equations
technical description (the tracer is modelled as scalar using a flux-form
equation similar to
that for specific humidity), and also a summary of the
model physics and dynamics options, as
well as other general information is available.
Limitations to such an approach compared to reality
This simplified approach is just to see where a
hypothetical ash cloud or plume would be transported given
the ASP forecasted winds and precipitation: One must
keep in mind several things when viewing these plots!
First, nearly all physics related to volcanic ash and it's
interactions with the atmosphere are highly simplified or
neglected here.
The dust concentrations are arbitrary! How these are related
to real atmospheric dust concentrations is not accounted
for. Second, winds and precipitation, those processes having the
most impact on the atmospheric dust, are the variables
subject to the most error in weather forecasting using
atmospheric models. This
applications is, in other words, just for fun...
so don't cancel your flight plans based on
these graphical results!


