Real Time Standard Forecast
Plots of Interest
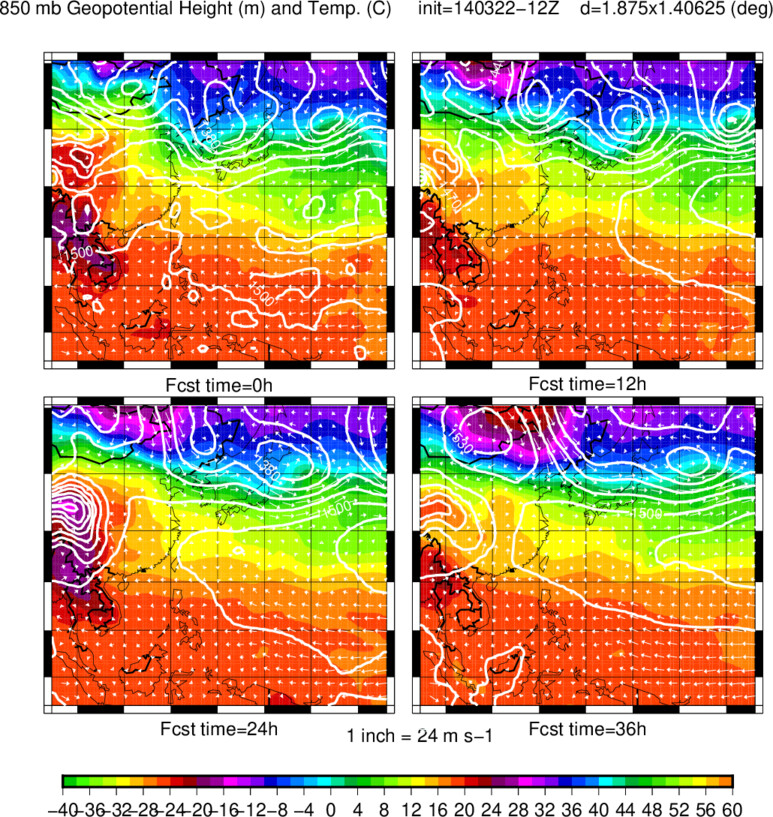
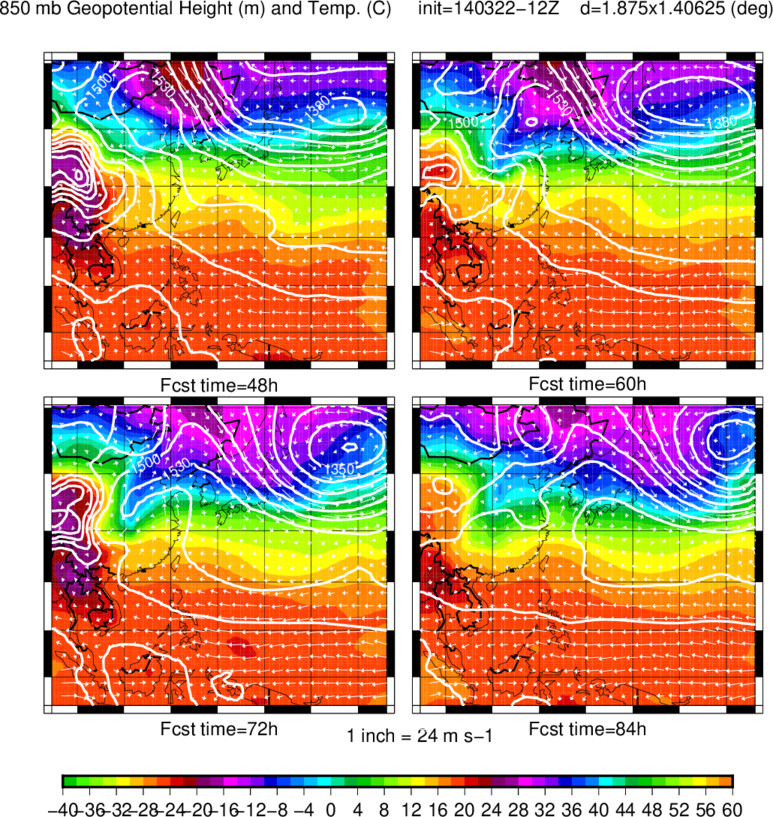
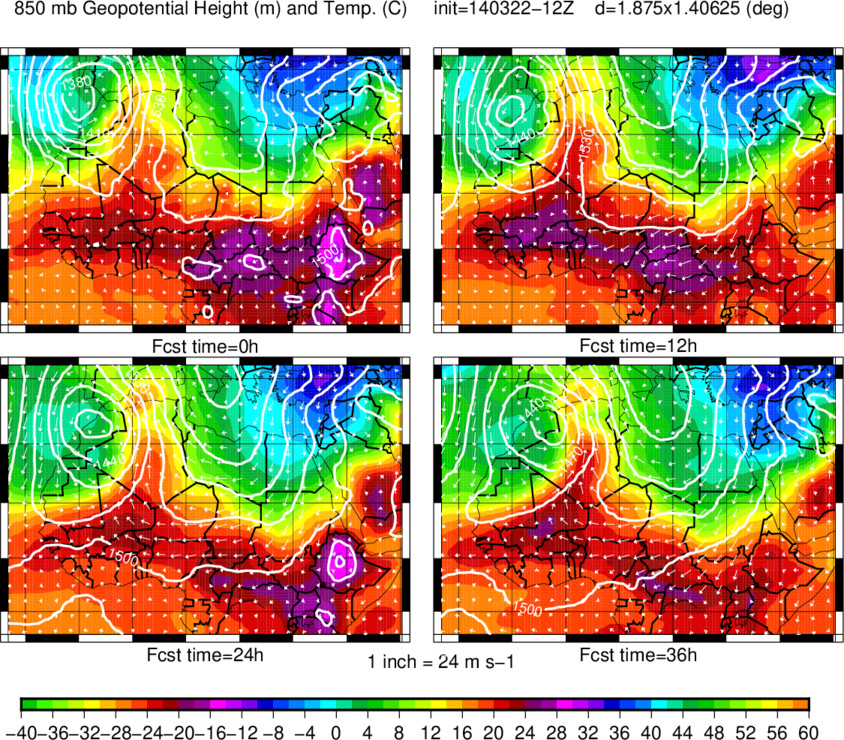
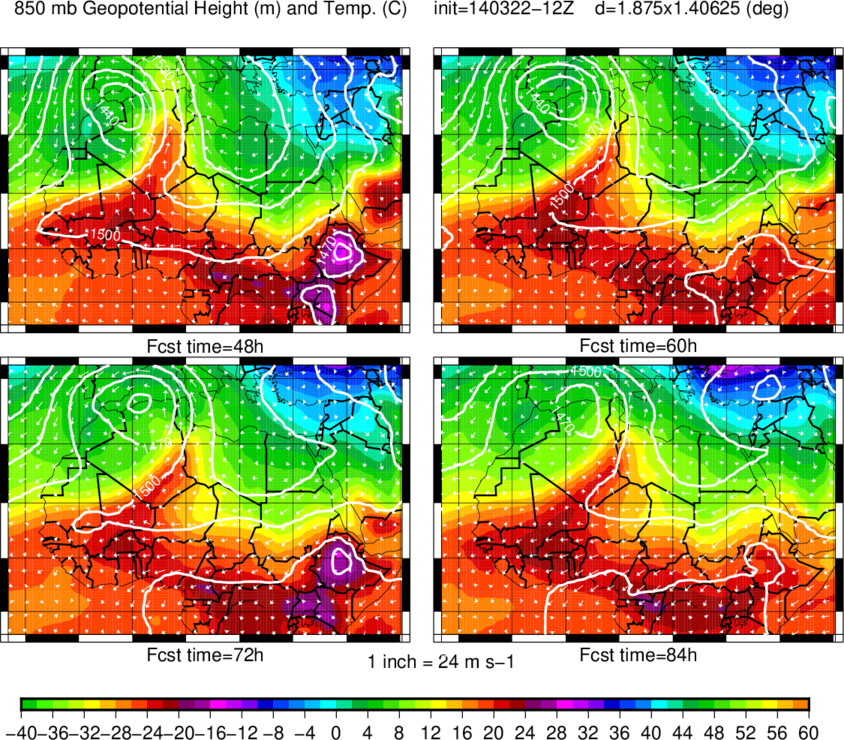
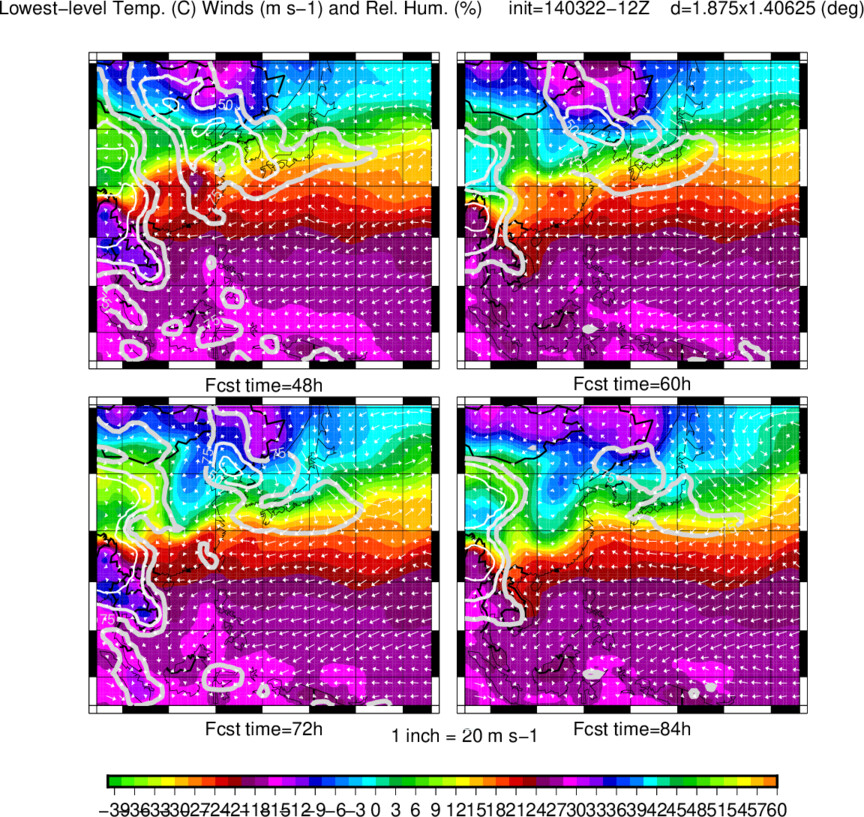
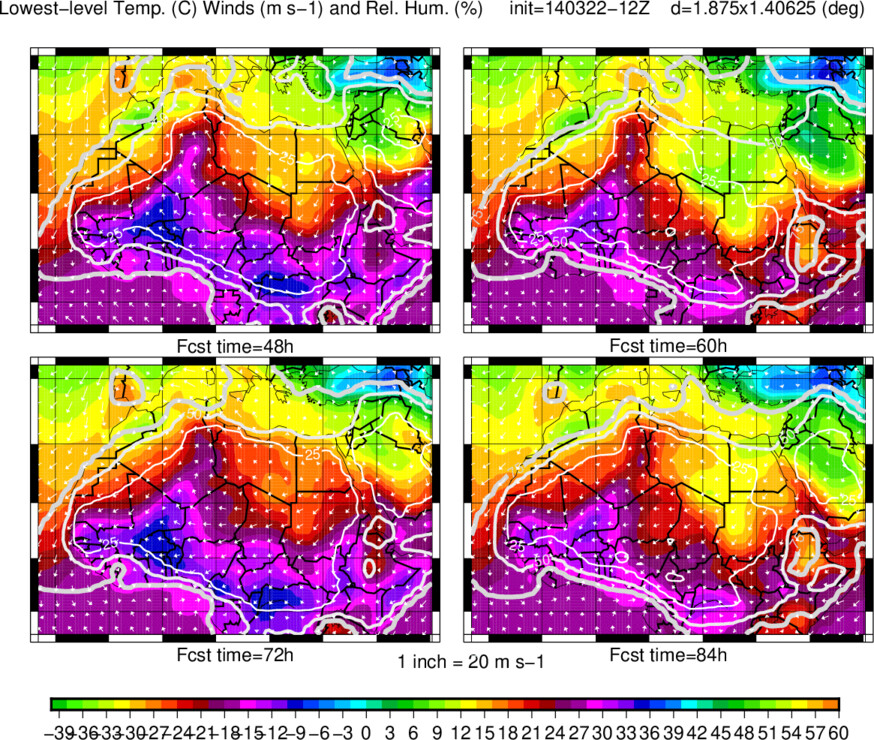
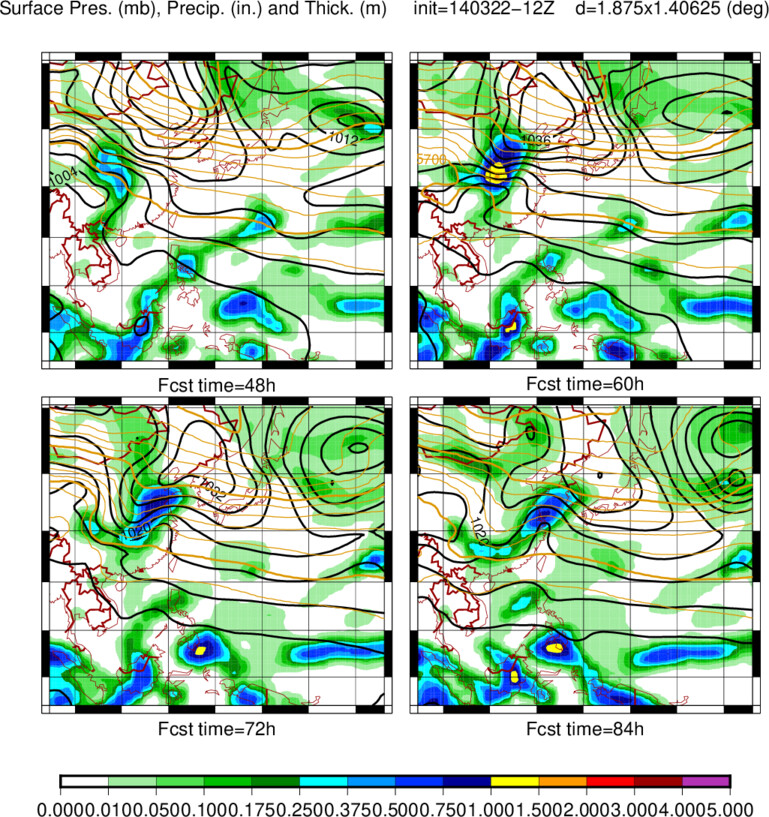
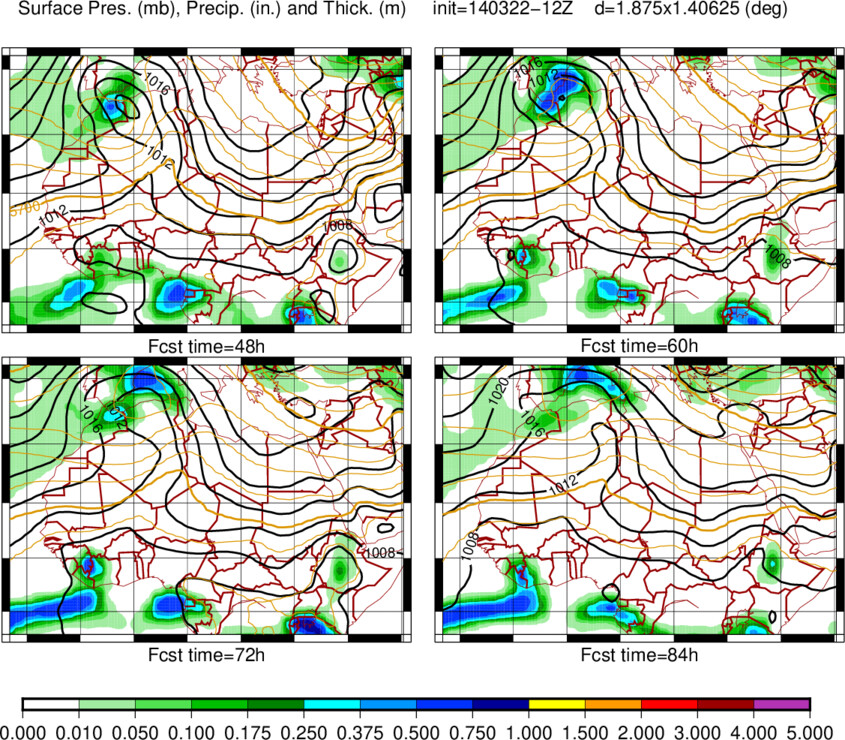
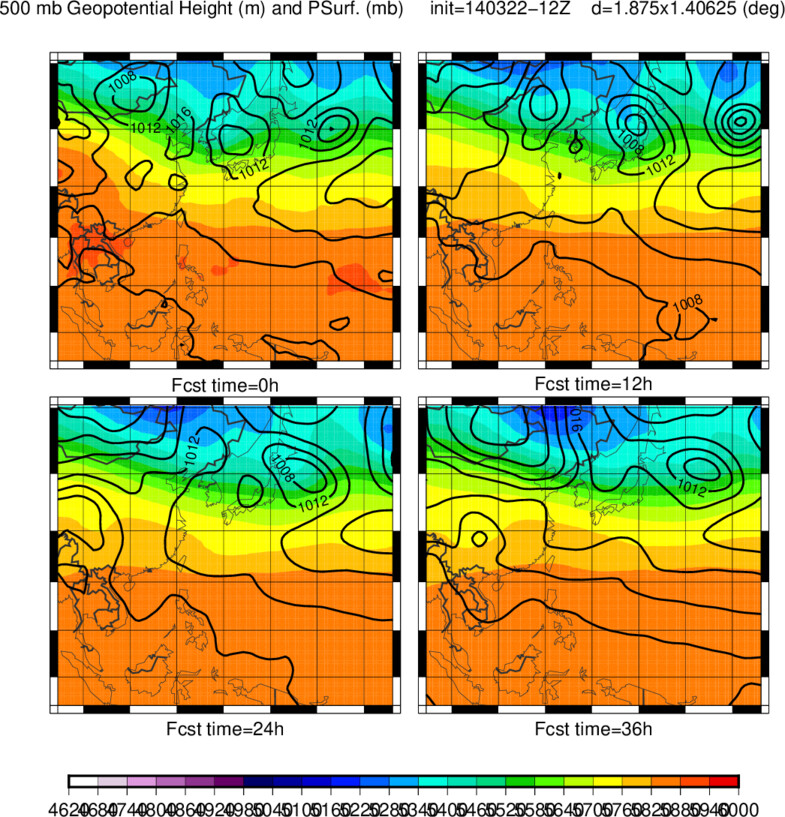
Select plots can be seen here for the global domain:
the model is still in test mode, so there could be
an occasional missed forecast or outputs to be improved upon.
The model uses a platte-carre projection (lat-lon)
on a (finite difference) C-grid.
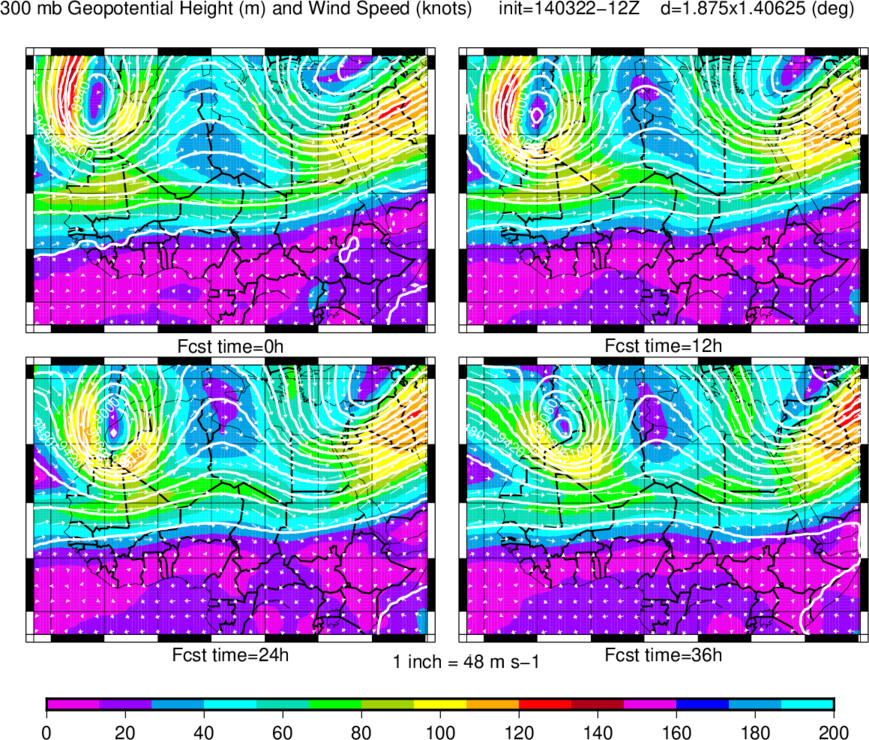
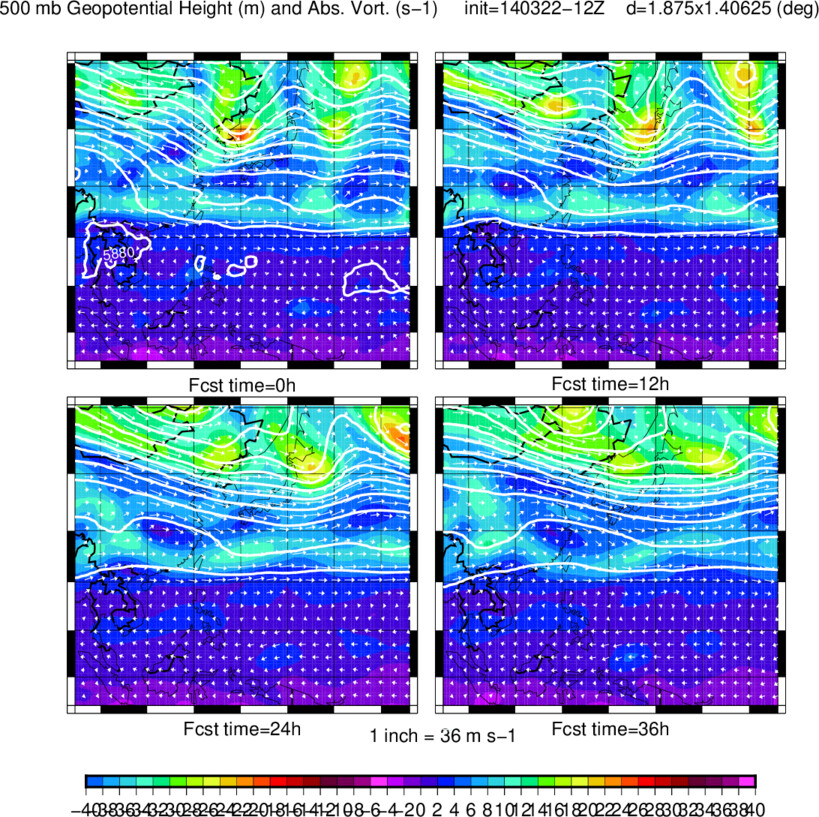
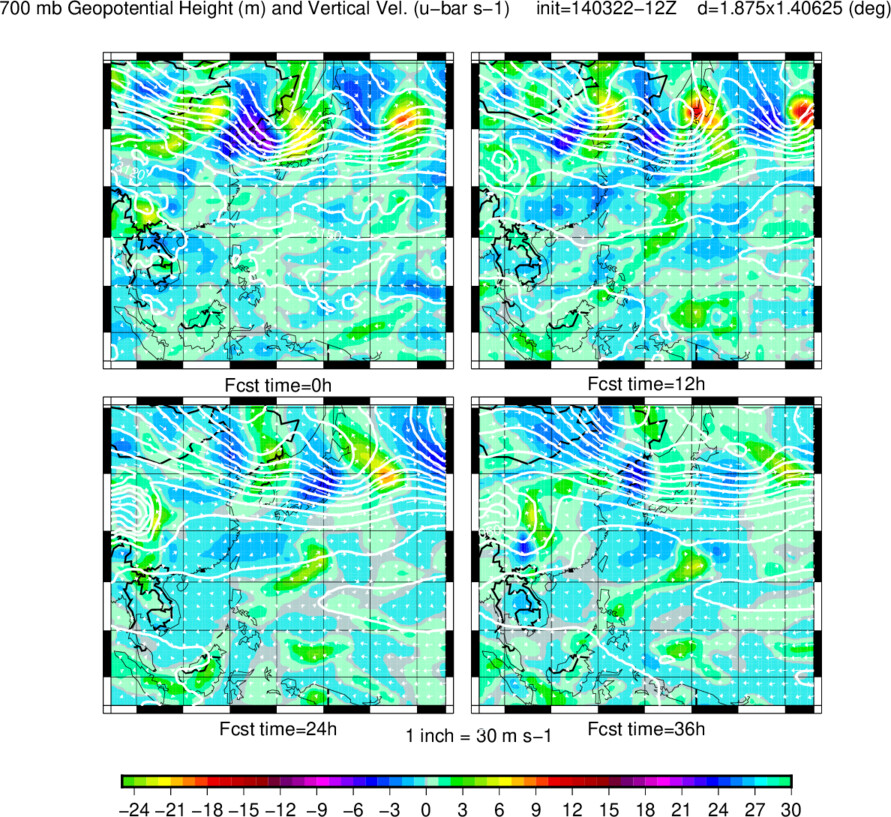
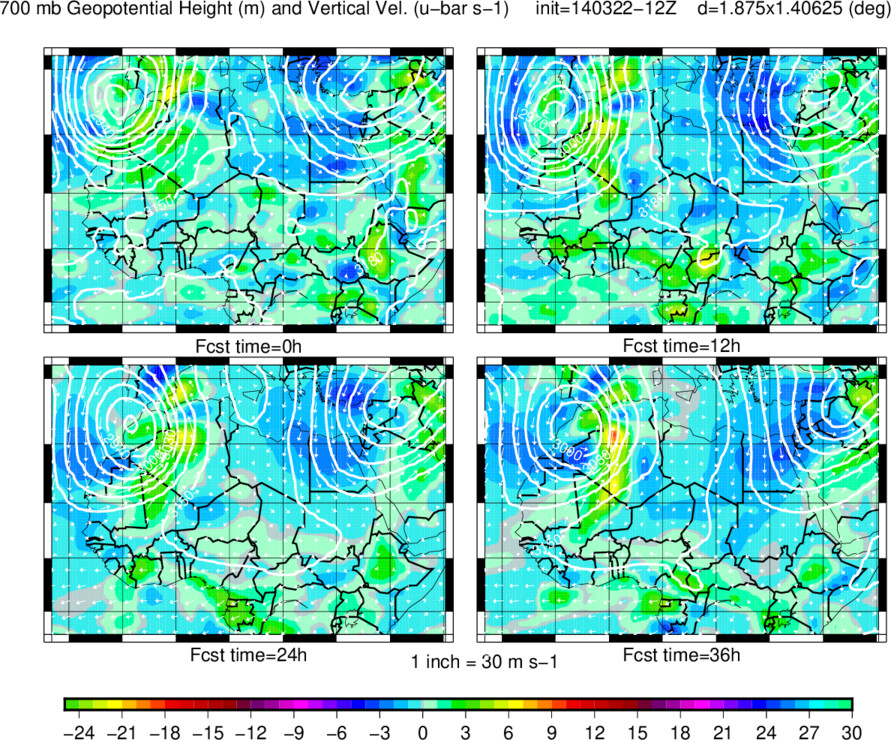
Currently, runs are usually done on grids of (degrees, lon X lat):
- 0.93750 X 0.75000 (default, about 80x80km at mid latitudes),
- 1.12500 X 0.84375... or
- 1.40625 X 1.12500 or
- 1.87500 X 1.40625
See plots
to know which resolution was used for the current forecast
(indicated in upper right part of plots).
Above a critical
latitude, Fourier Filtering (polar filtering)
of mass variables is used (i.e. the product of the
specific density and T, u, v
are filtered, along with psurf).
The latitudinal grid spacing has been selected such that
grid boxes are approximately squares at the cut-off
latitude (generally in mid-latitudes).
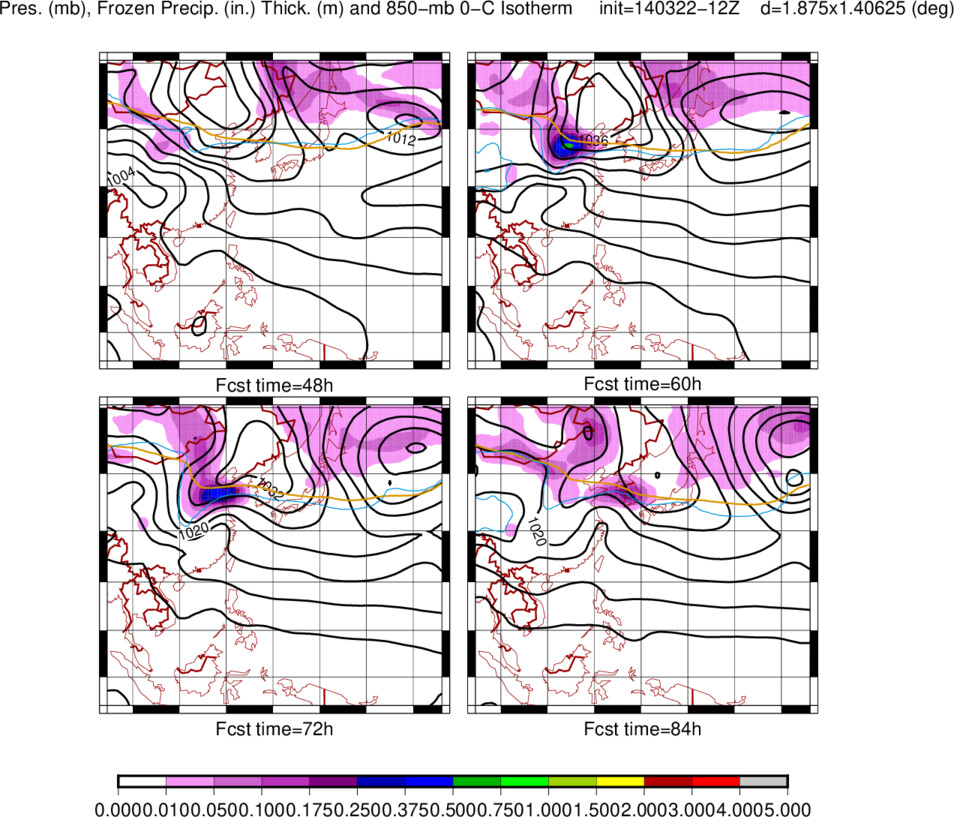
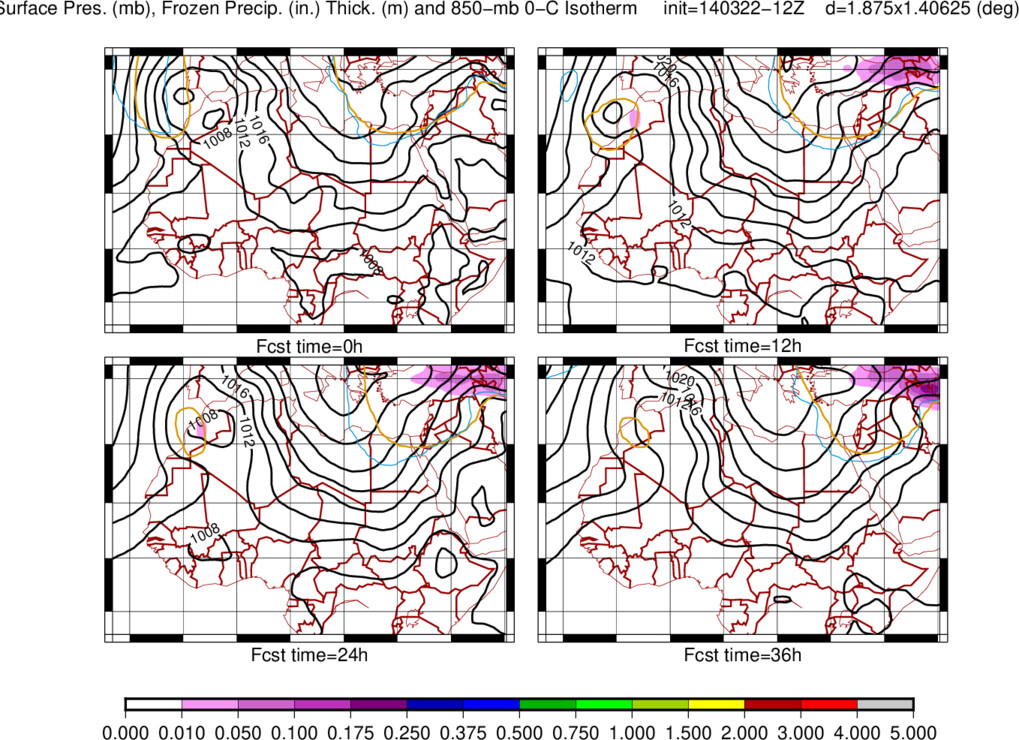
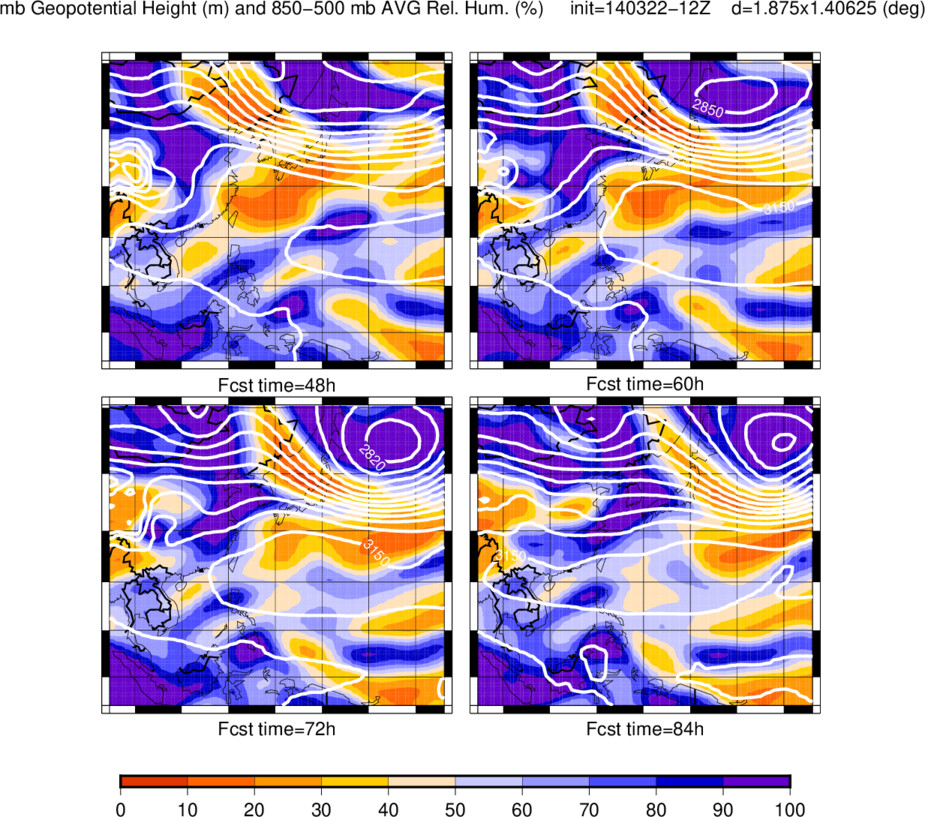
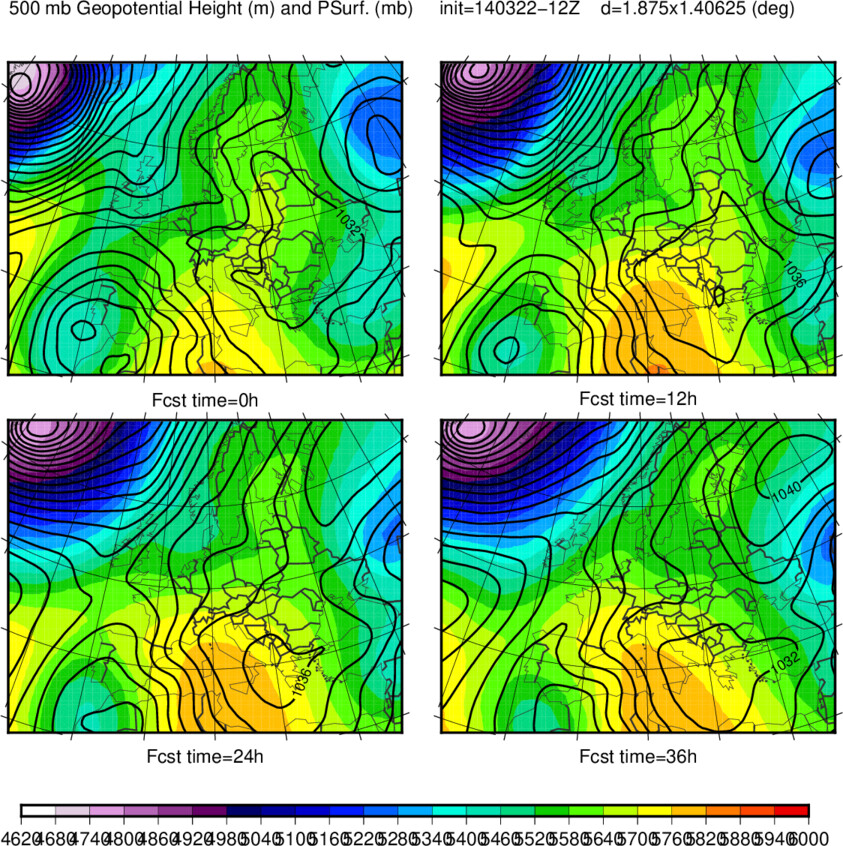
The initial fields and 3.5 day forecasts
(0 to 84 hour forcasts, every 12 hours)
can be seen below by clicking on
the appropriate links (below).
The model uses the same physics and dynamic core as the
limited area model version of ASP.
The global model uses a larger grid spacing than the LAM
model, so fields are slightly more smooth.
The model is initialized using input GFS data
(interpolated to the ASP grid), and a short forward and
backward adiatatic integration using a digital filter.
The model uses big-brother assimilation of
T, u, v
and psurf during the first
12h of the forecast (using GFS forecast data), which is
then tapered off by 18h.
The description of the global grid, polar filtering,
boundary conditions etc...can be found in the
ASP documentation pages.
Feel free to send any comments (aaron.a.boone@gmail.com).
Sub Domains
Several sub domains on the global grid are shown:
NA=North America, EU=Europe, AF=Africa, and EA=East Asia.
Hemisphere=a satellite view of a hemisphere (using an
Orthographic Projection). The Default is centered over the central
north Atlantic, however, for interesting meteorological phenomena,
the domain might be
centered elsewhere on the globe.
Finally, note that global plots might, at times, extend beyond the
3.5 default forecast (out to 5, 7 or even 10 days).
As a reference, the pressure levels above correspond to
the approximate heights
below in meters (and feet) for a
standard
atmosphere.
This can be used as a rough estimate of the height of the
dust plumes shown in the plots above.


