Aaron Boone's Homepage 
|
 |
| Home |
|
|
The Liberation of Chateau Gontier |
|
| Work |
|
| Wildlife Forays |
|
| Road Trips |
|
| Weather |
|
| Weather: LAM fcst |
|
| Weather: Global fcst |
|

|

Limited Area Model DomainsPage Menu
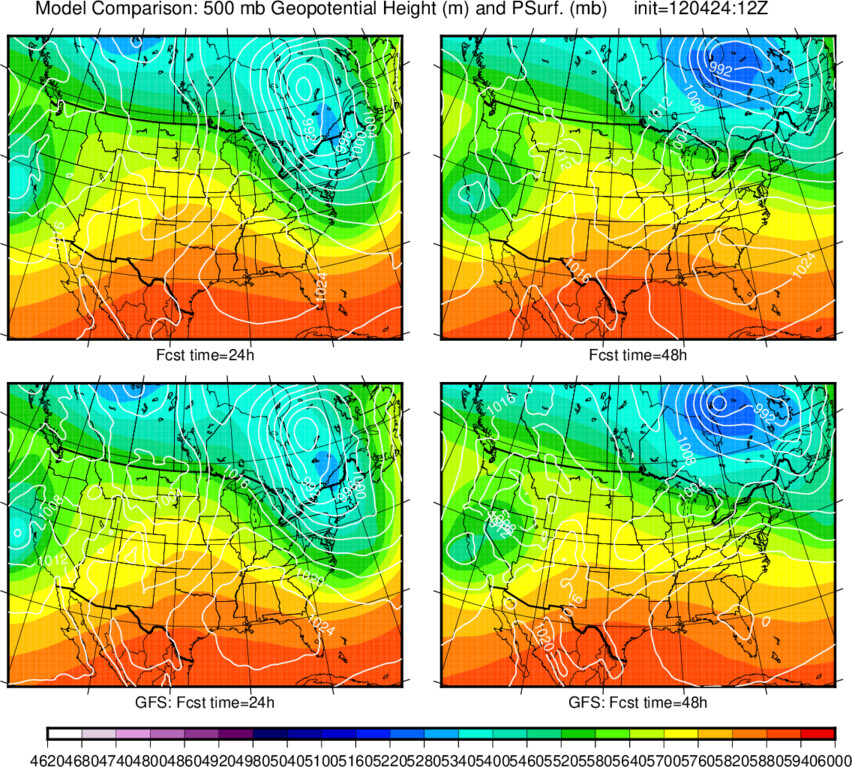
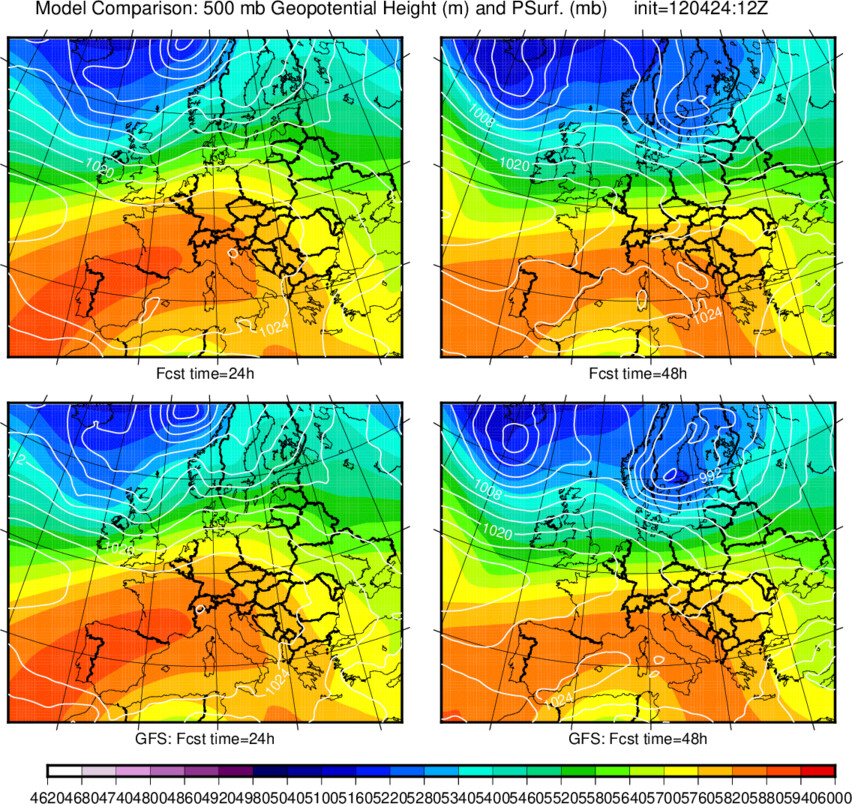
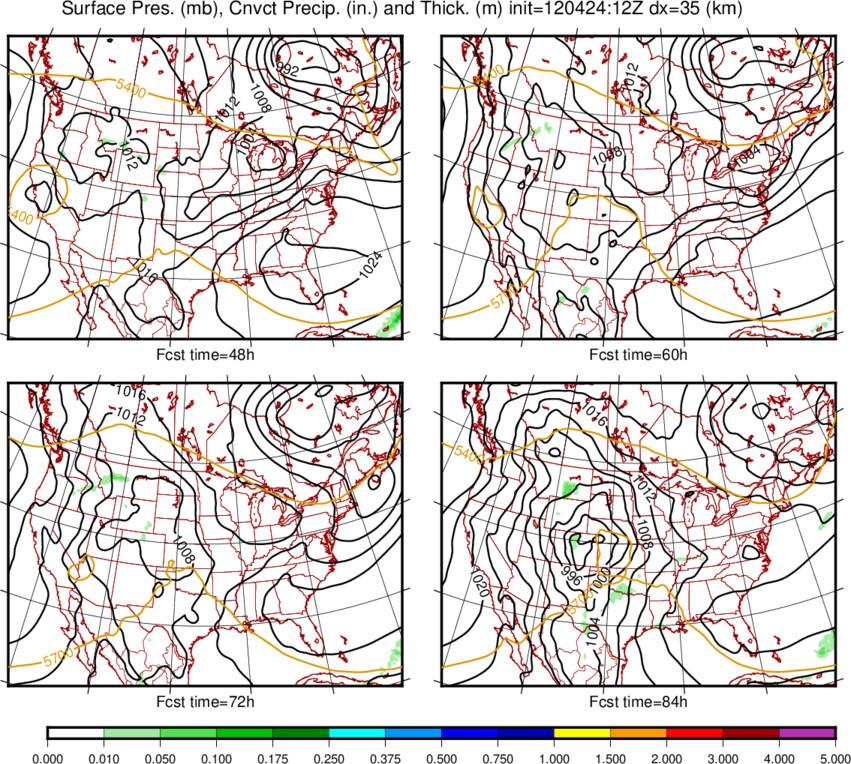
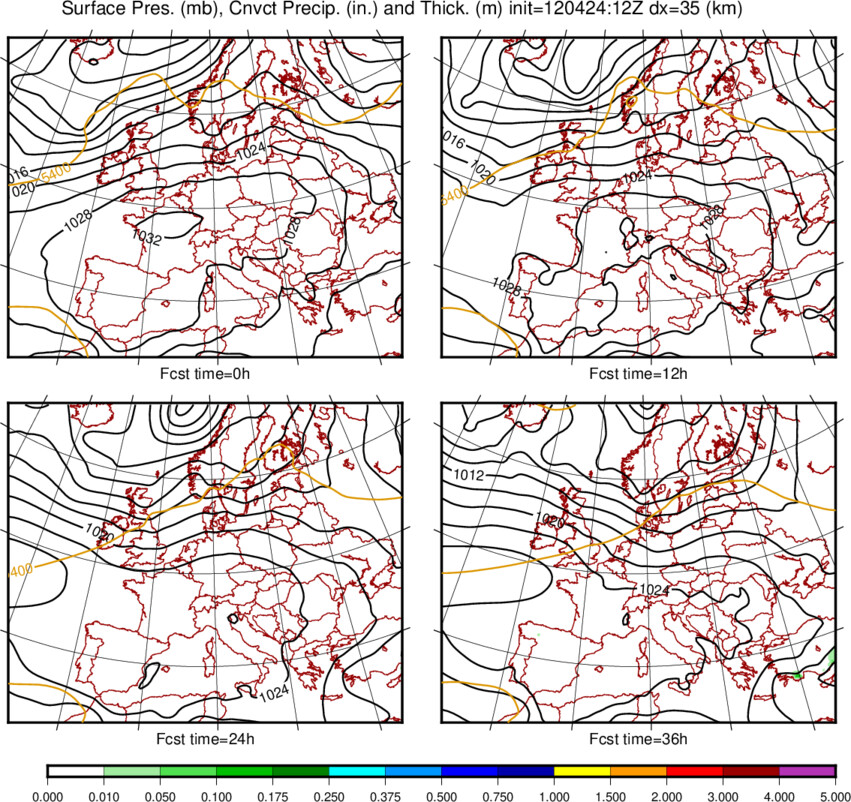
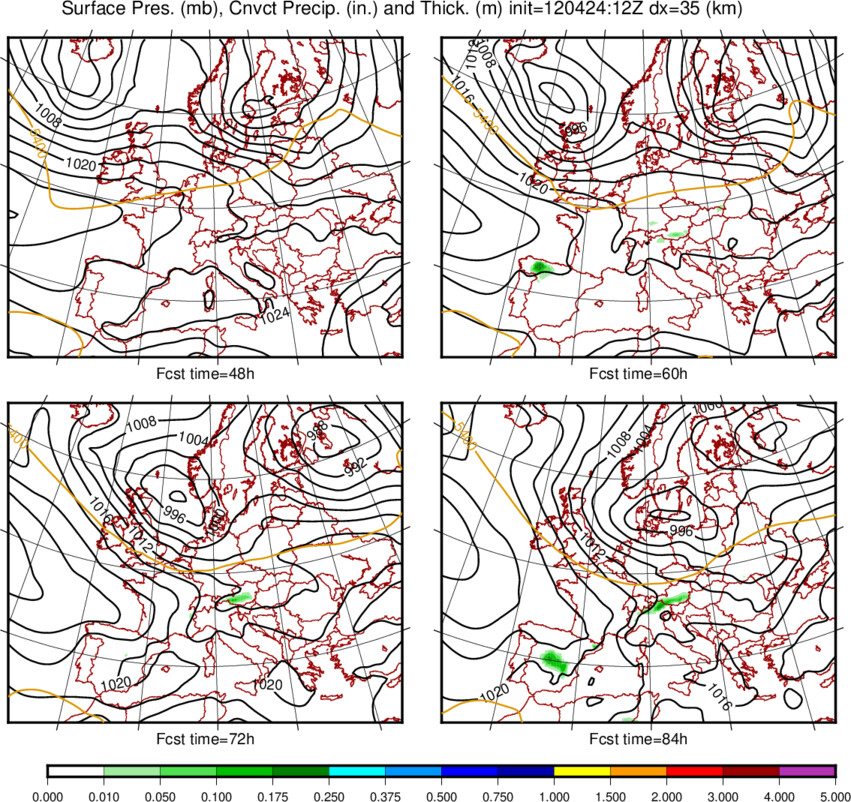
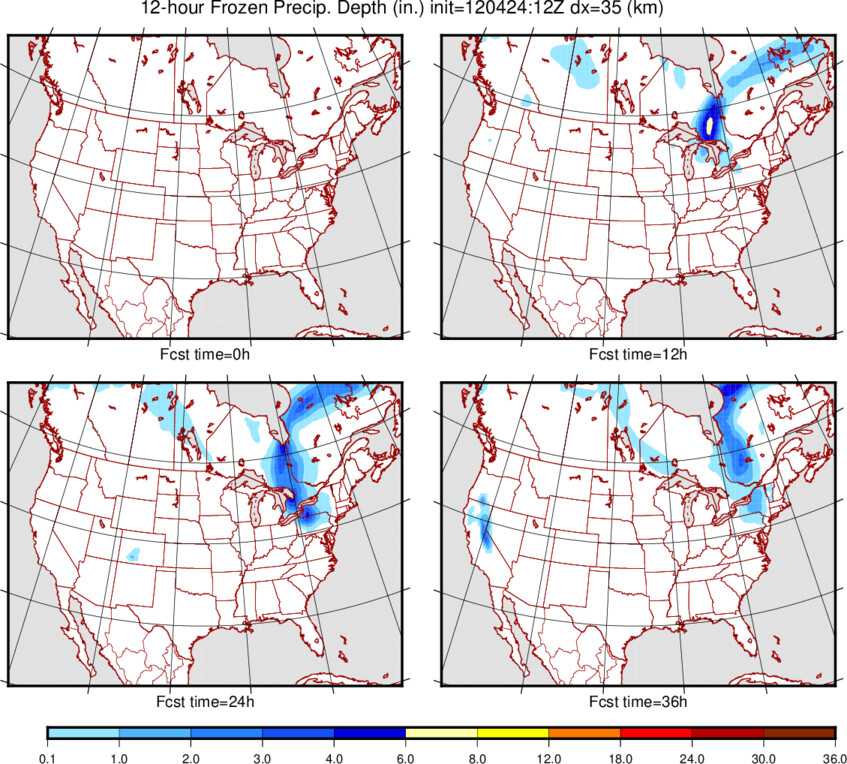
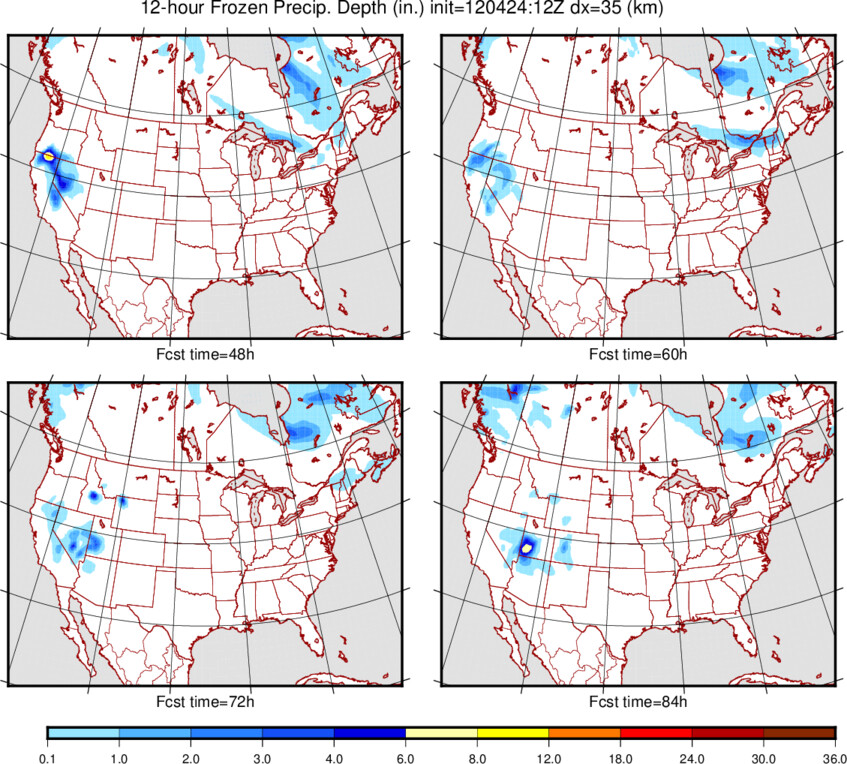
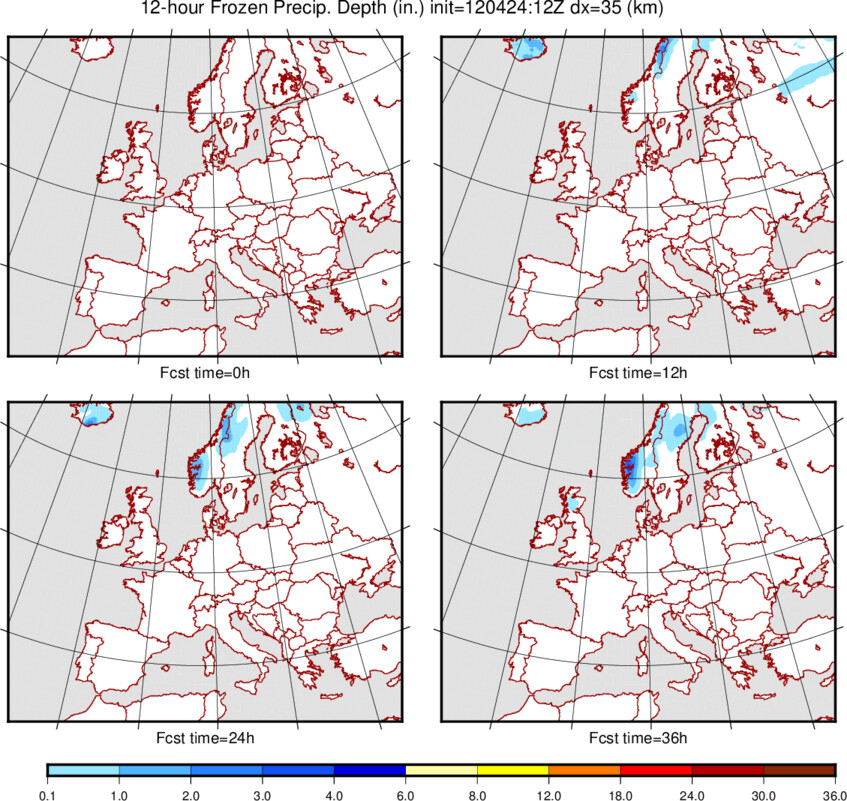
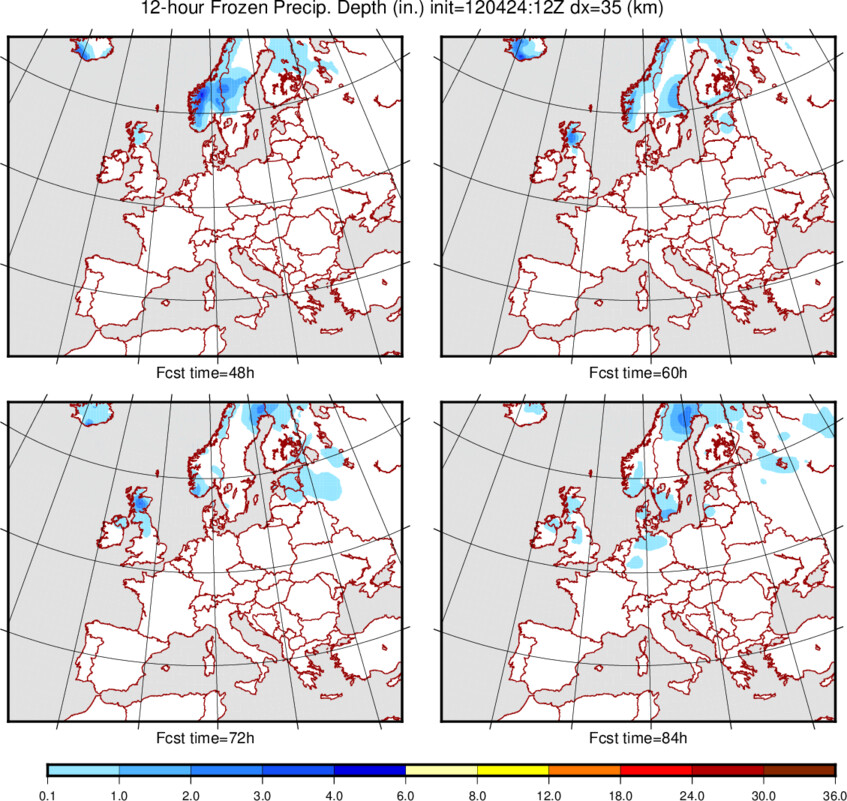
Real Time Forecast PlotsGFS-ASP Comparison Forecast PlotsComparison plots (500 mb Height and Surface Pressure) which show the forecasts for both ASP and the GFS model are plotted for the North American Domainand the European Domainfor the same forecast increments (and both starting at the same time using the same GFS analysis fields for initialization). Note that the plotted GFS fields are those interpolated from the original GFS global fields, so some very small differences between these fields and those presented, for example, on the NCEP-GFS site are posible. Finally, note that these are not validation plots, as the GFS data plotted are forecast data: differences don't necessarily imply a *better* GFS forecast! Animated US and Europe surface pressure and
precip fcst maps
|
||||||||||||||||||||||||||||||||||||||||||||||||||||||||||||||||||||||||||||||||||||||||||||||||||||||||||||||||||||||||||||||||||||||||||||||||||||||||||||||||||||||||||||||||||||||||||||||||||||||||||||||||||||||||||||||||||||||||||||||||||||||||||||||||||||||||||||||||||||||||||||||||||||||||||||||||||||||||||||||||||||||||||
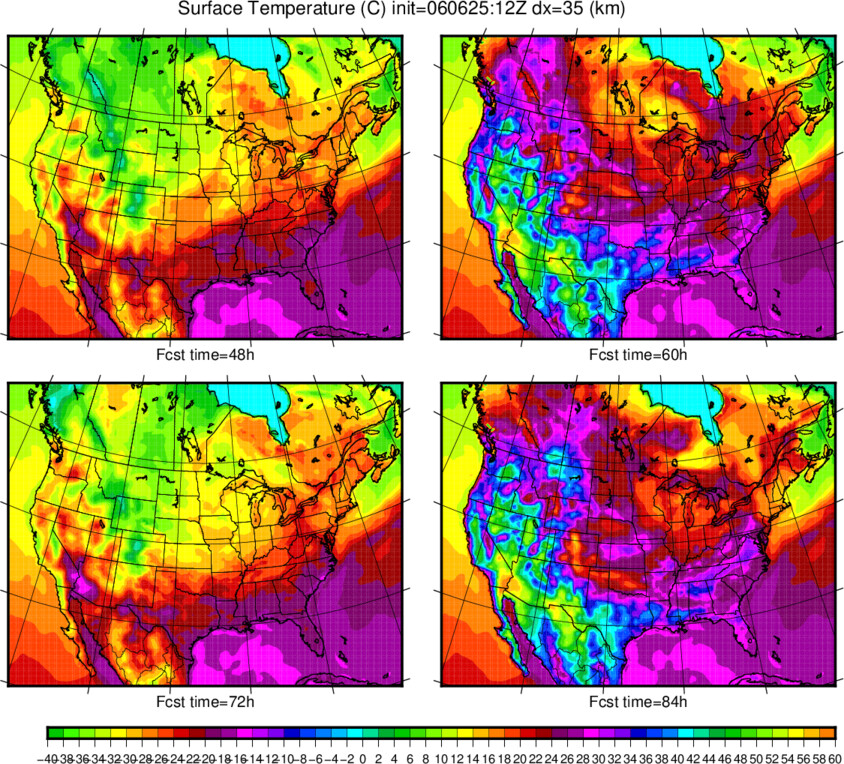
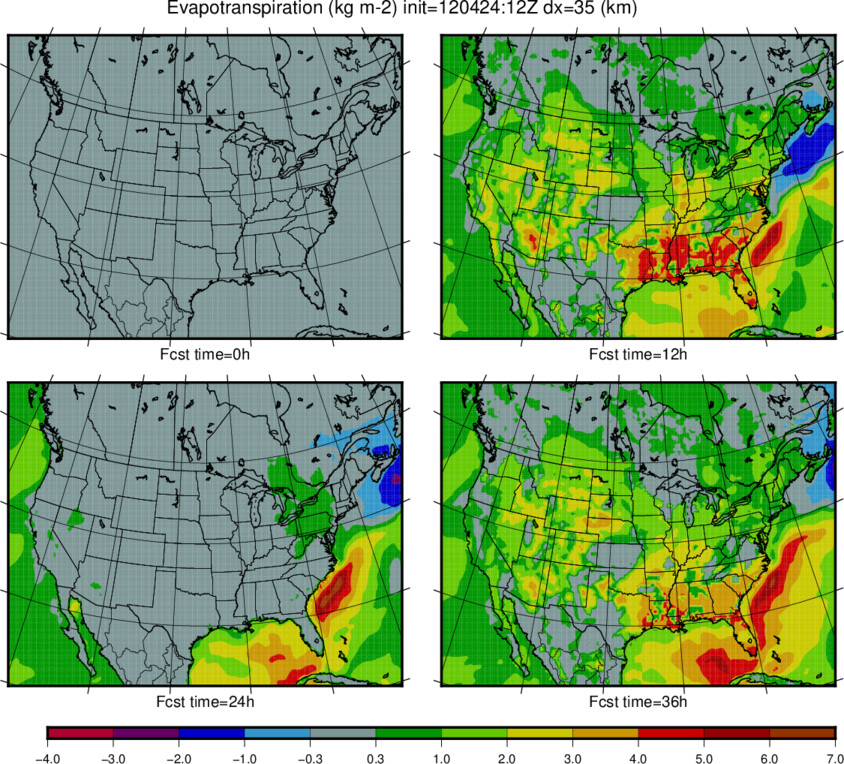
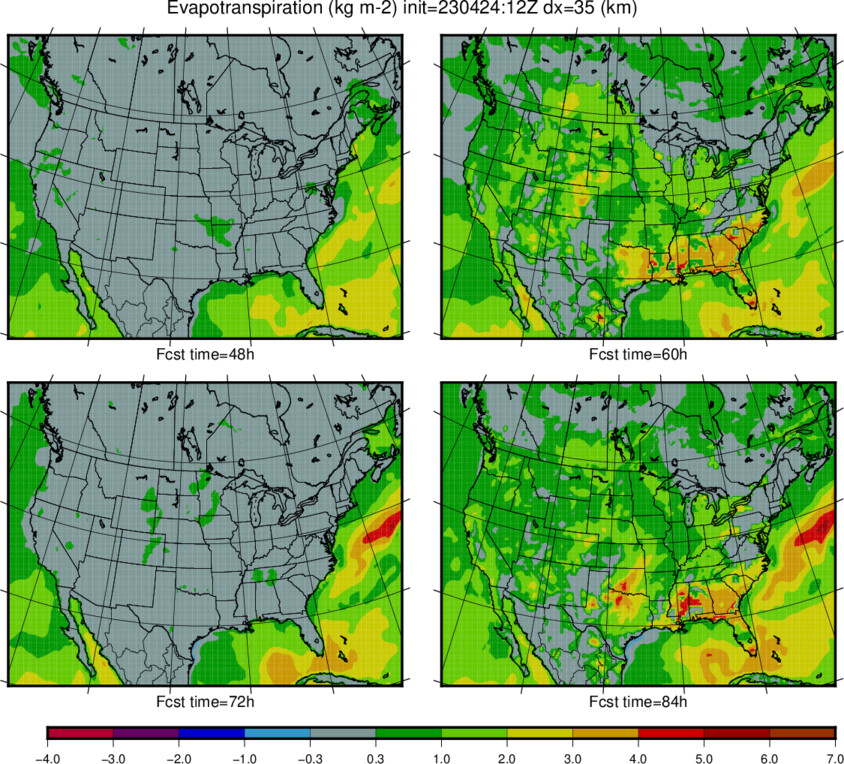
| North America | Psurf and Precip | 2m-Tair | ||||||||||||||||||||||||||||||||||||||||||||||||||||||||||||||||||||||||||||||||||||||||||||||||||||||||||||||||||||||||||||||||||||||||||||||||||||||||||||||||||||||||||||||||||||||||||||||||||||||||||||||||||||||||||||||||||||||||||||||||||||||||||||||||||||||||||||||||||||||||||||||||||||||||||||||||||||||||||||||||||||||||
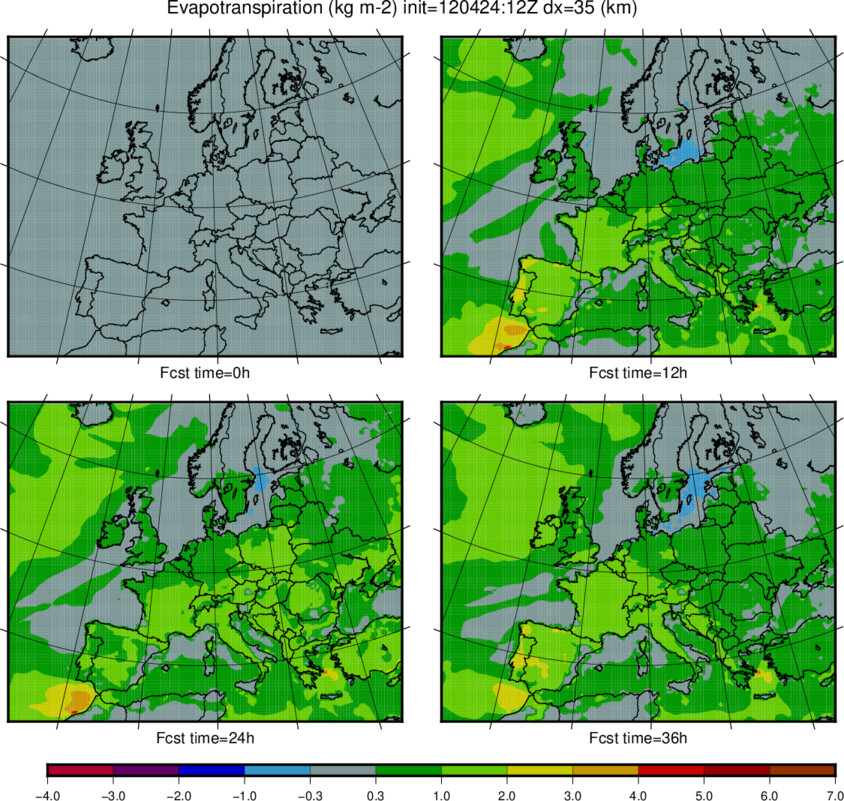
| Europe | Psurf and Precip | 2m-Tair |
| Field | North America | North America | Europe | Europe |
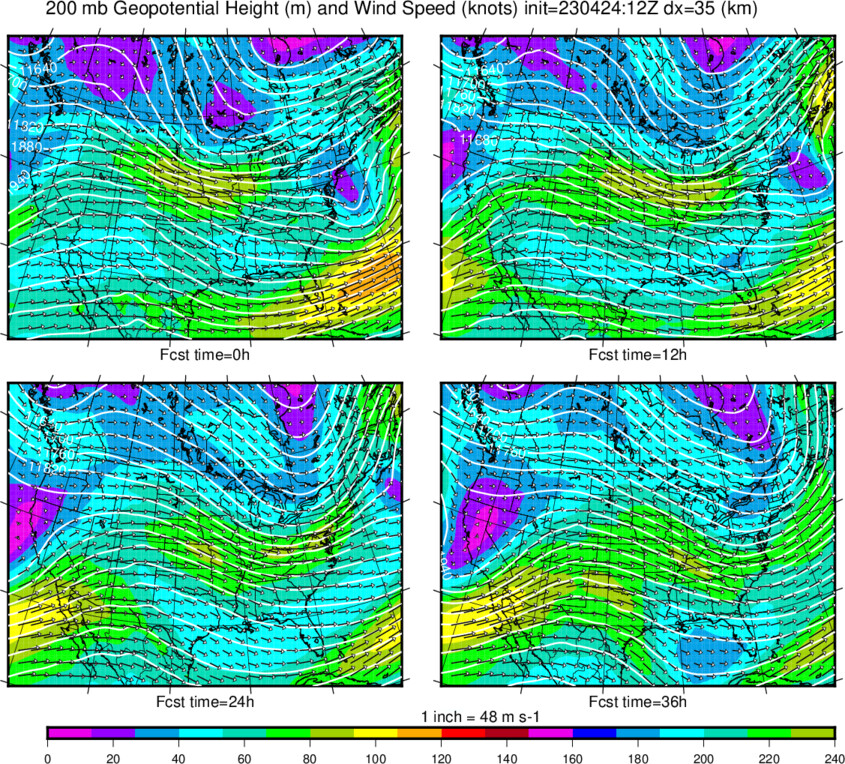
| 200 Hgt, WindV, WindS | 0-36h | 48-84h | 0-36h | 48-84h |
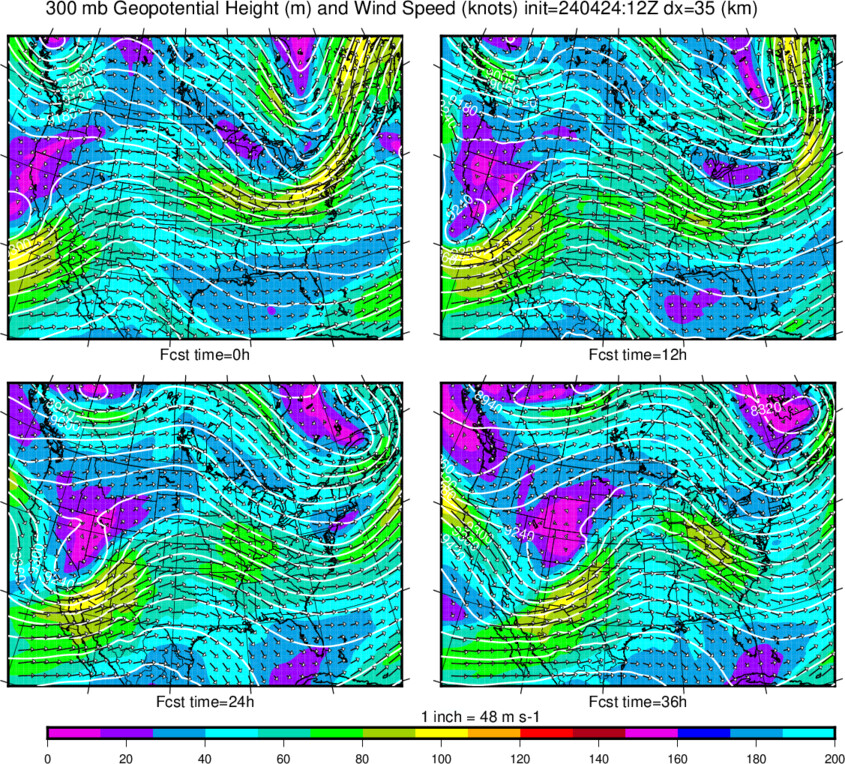
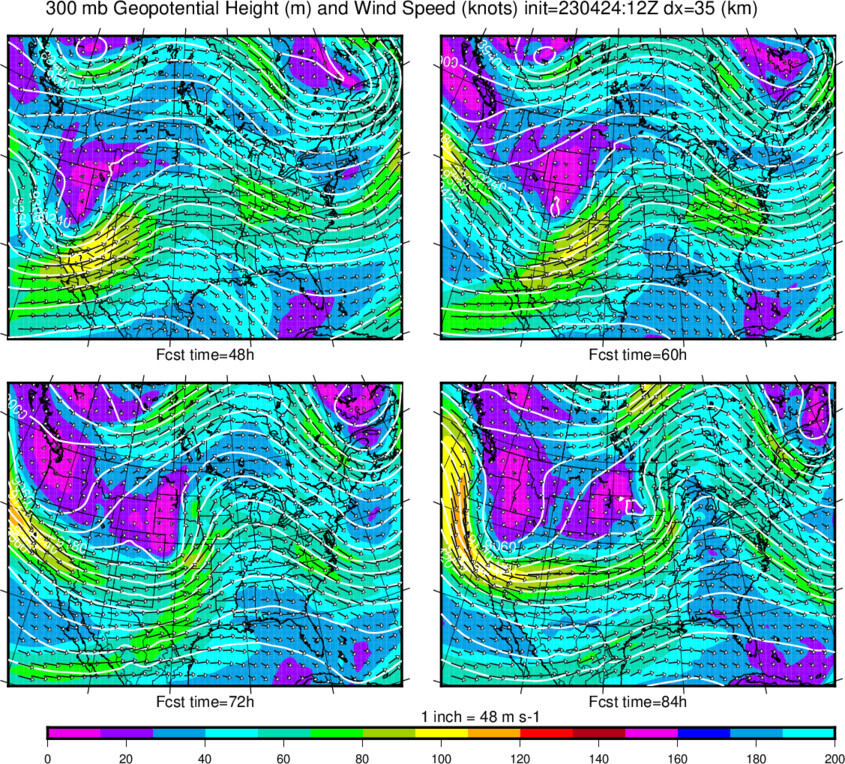
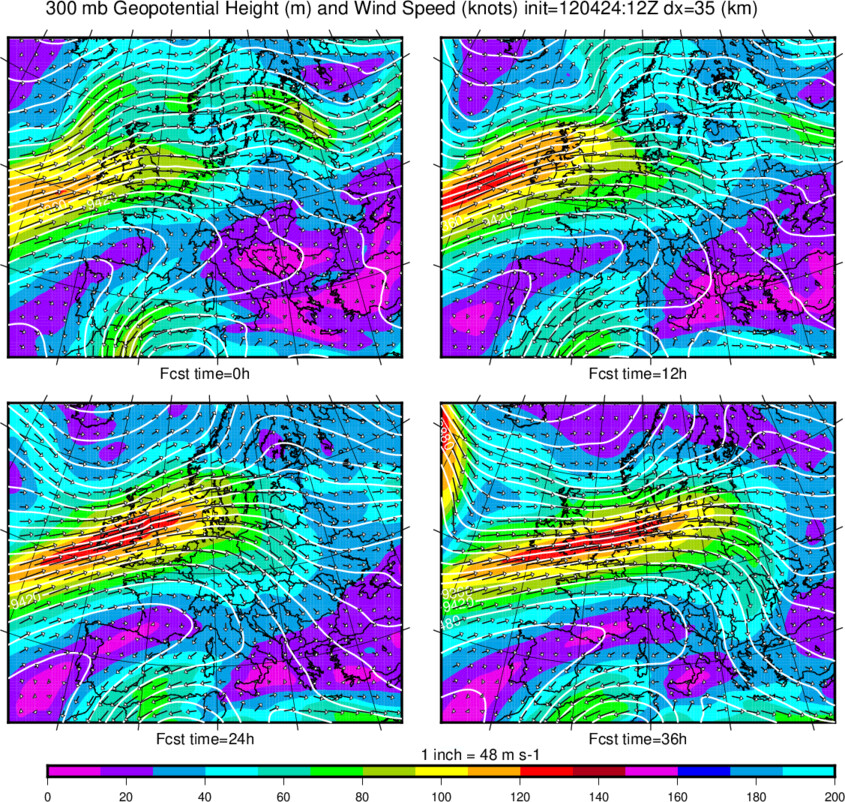
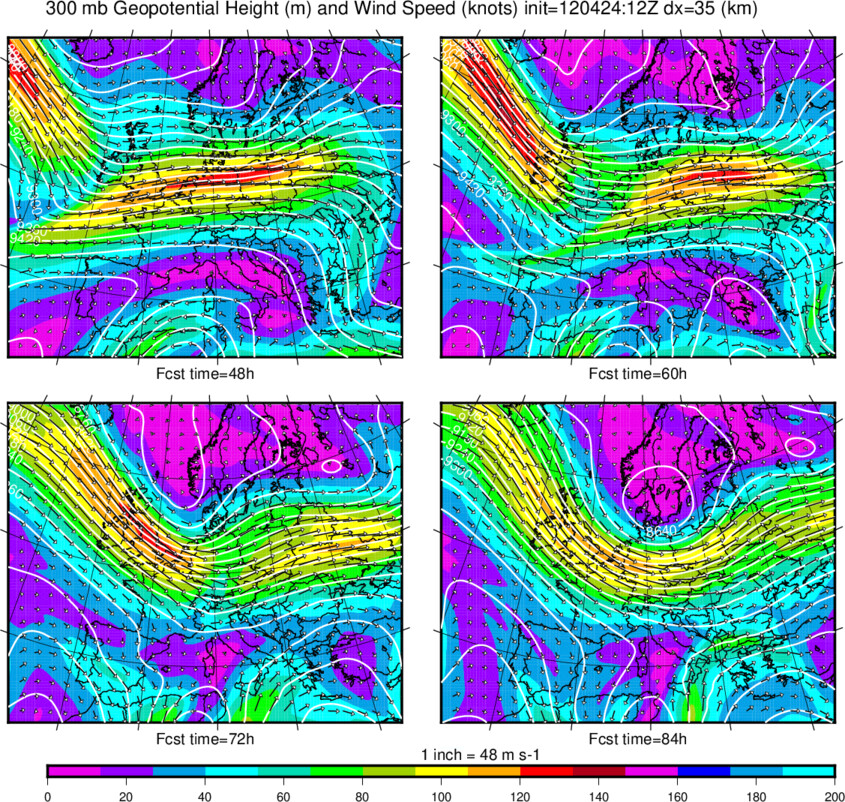
| 300 Hgt, WindV, WindS | 0-36h | 48-84h | 0-36h | 48-84h |
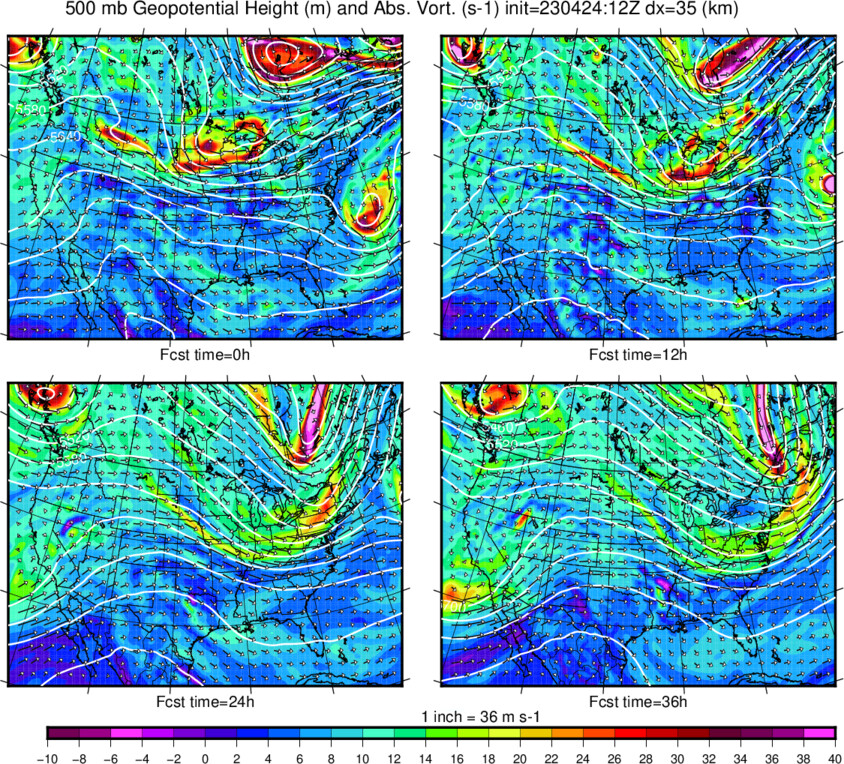
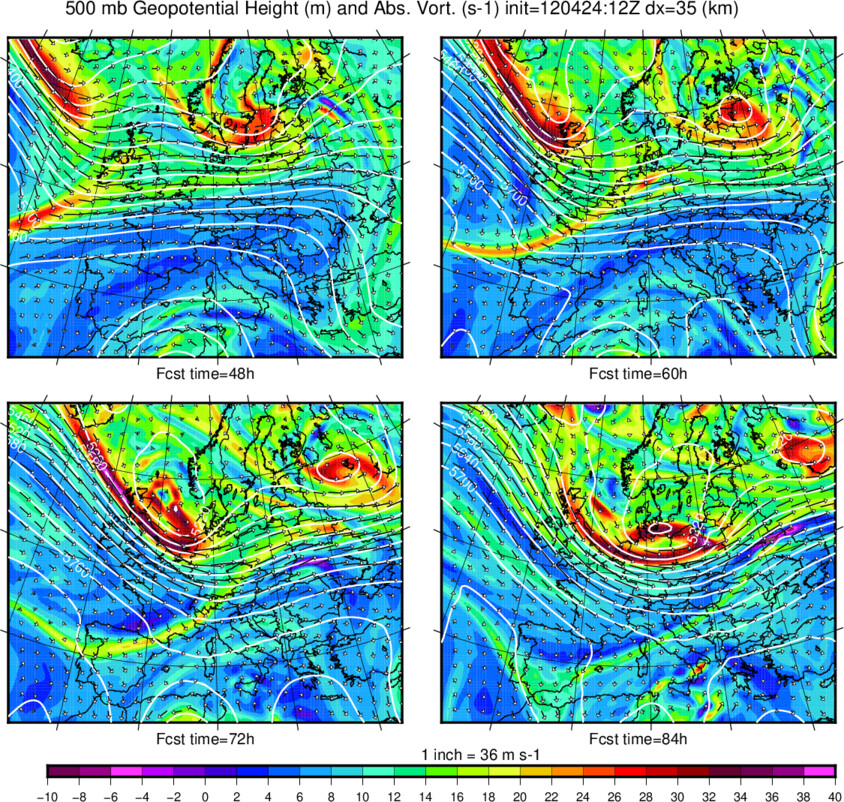
| 500 Hgt, WindV, AbsVort | 0-36h | 48-84h | 0-36h | 48-84h |
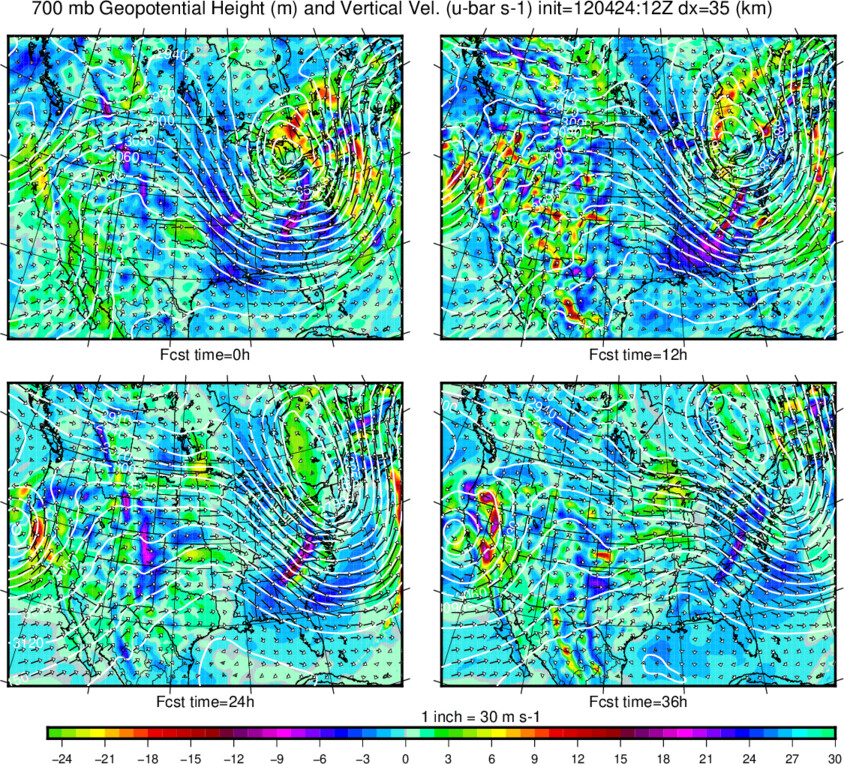
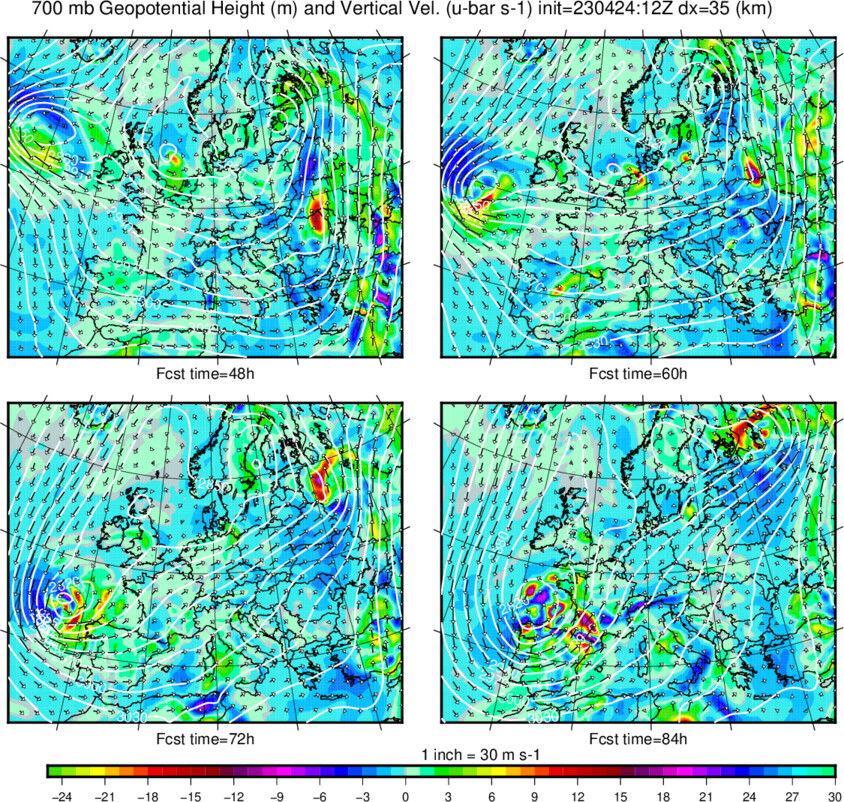
| 700 Hgt, WindV, VVel | 0-36h | 48-84h | 0-36h | 48-84h |
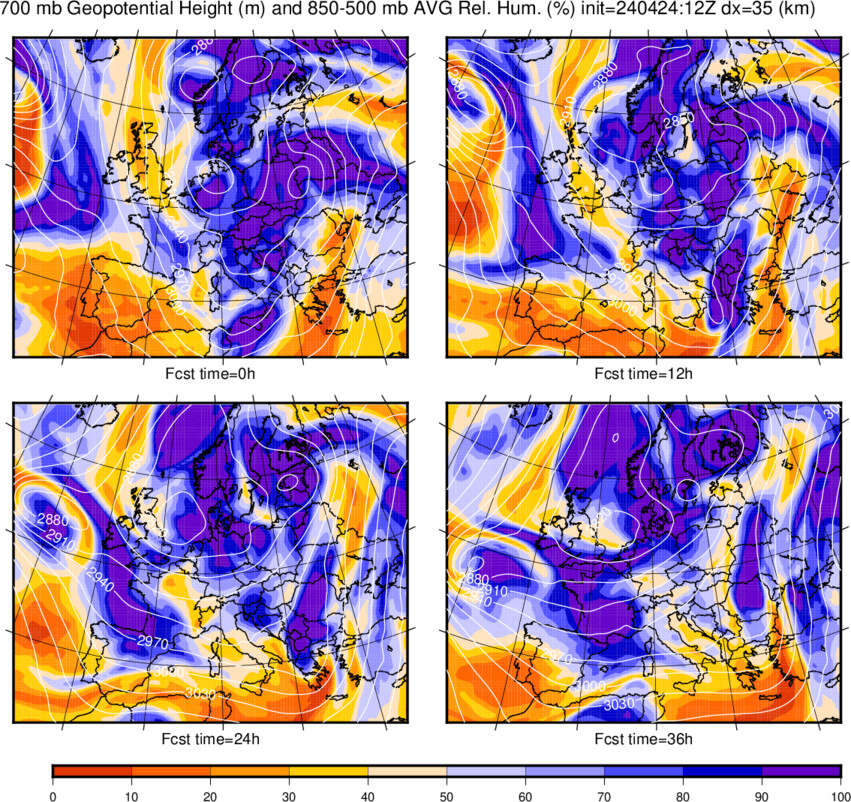
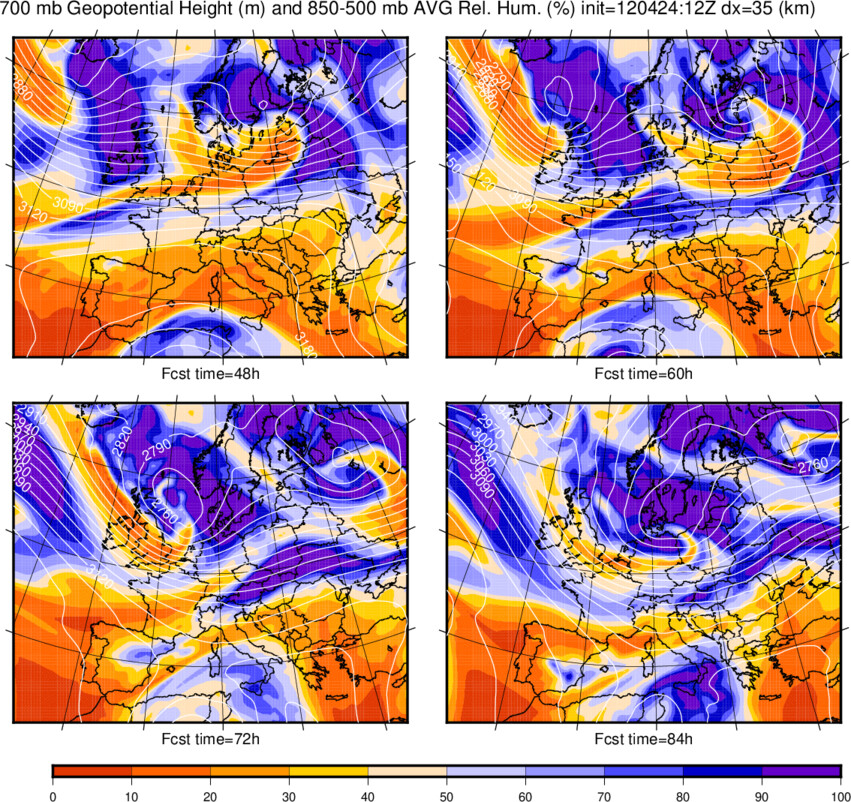
| 700 Hgt, 850-500 mb RHavg | 0-36h | 48-84h | 0-36h | 48-84h |
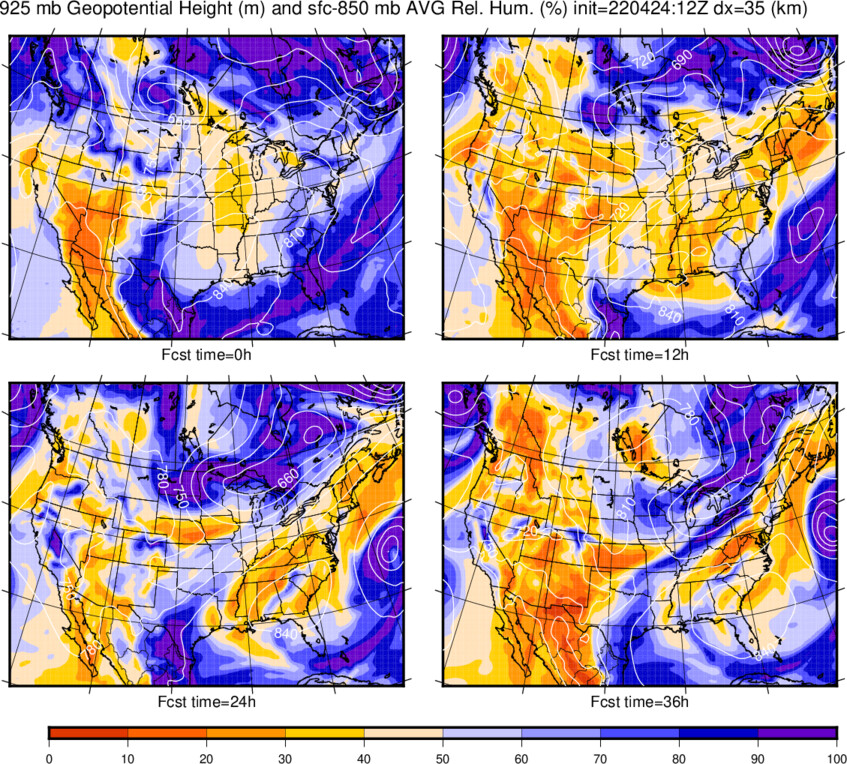
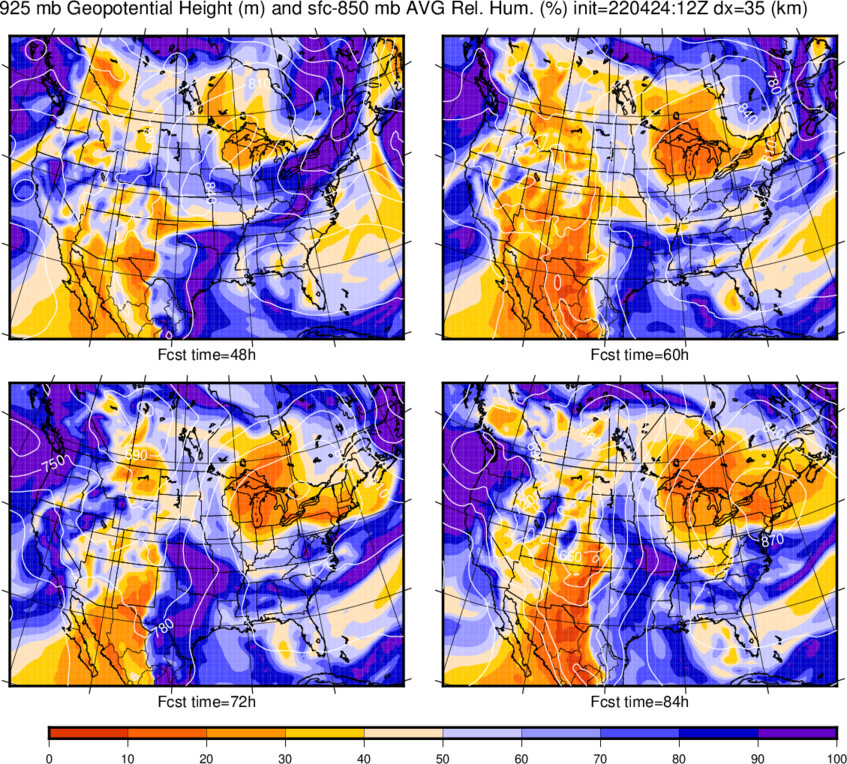
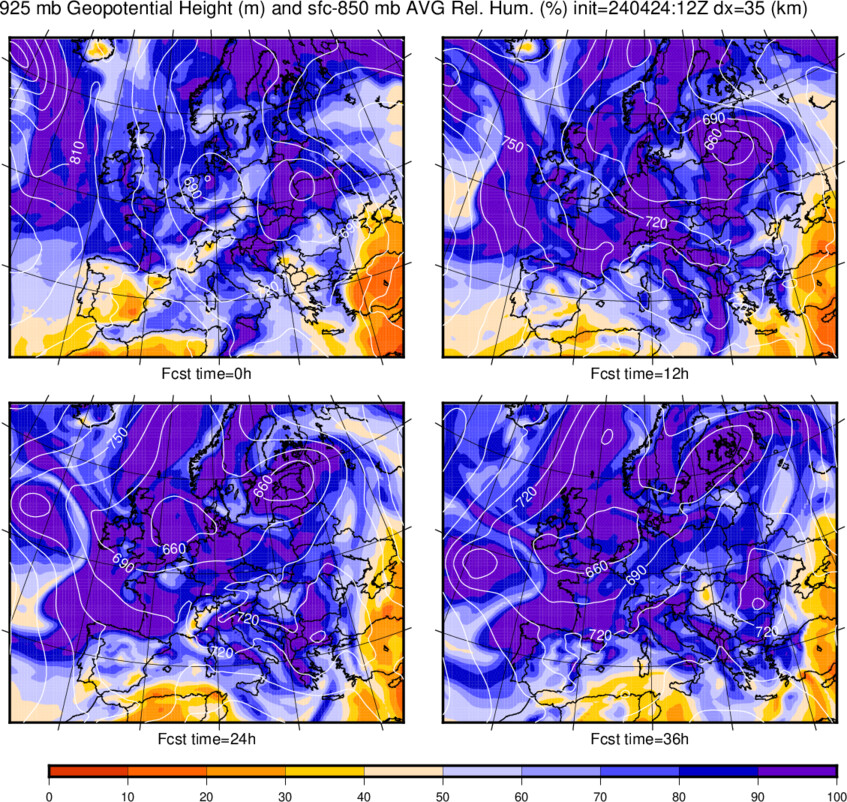
| 925 Hgt, surf-850 mb RHavg | 0-36h | 48-84h | 0-36h | 48-84h |
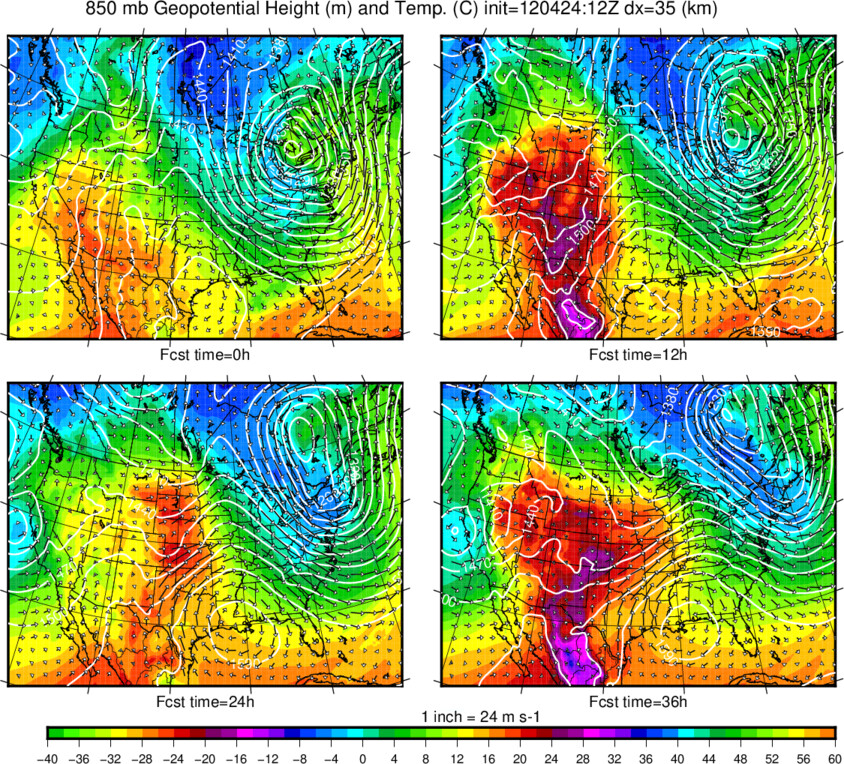
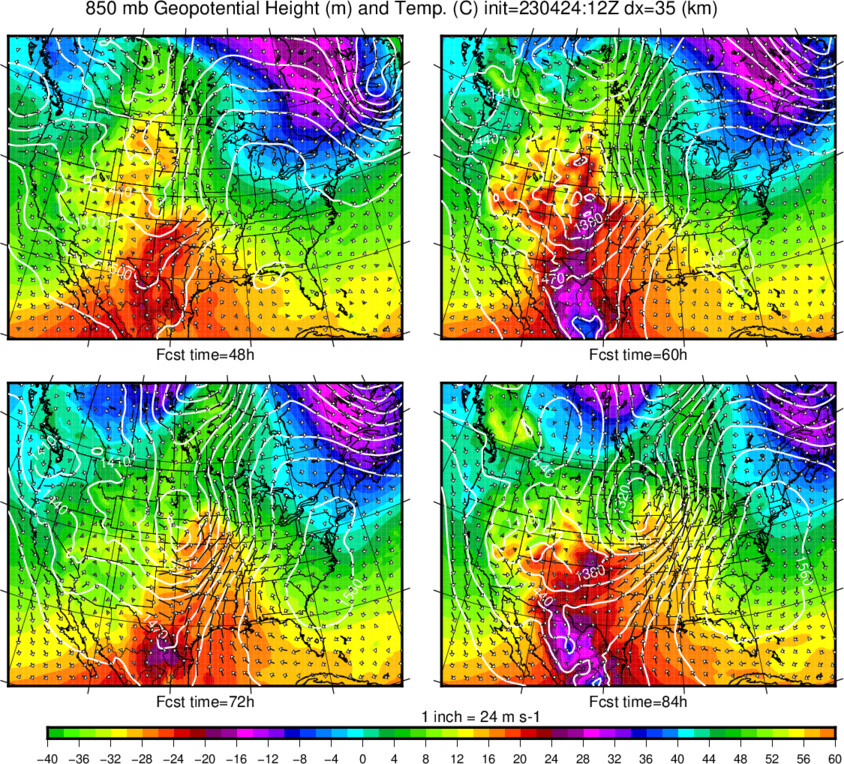
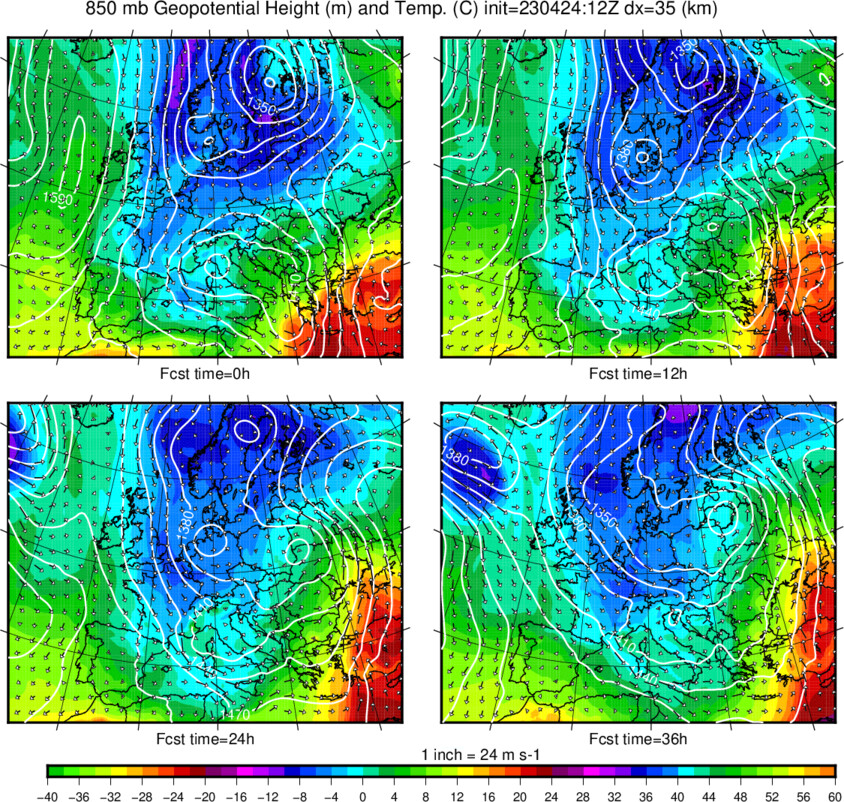
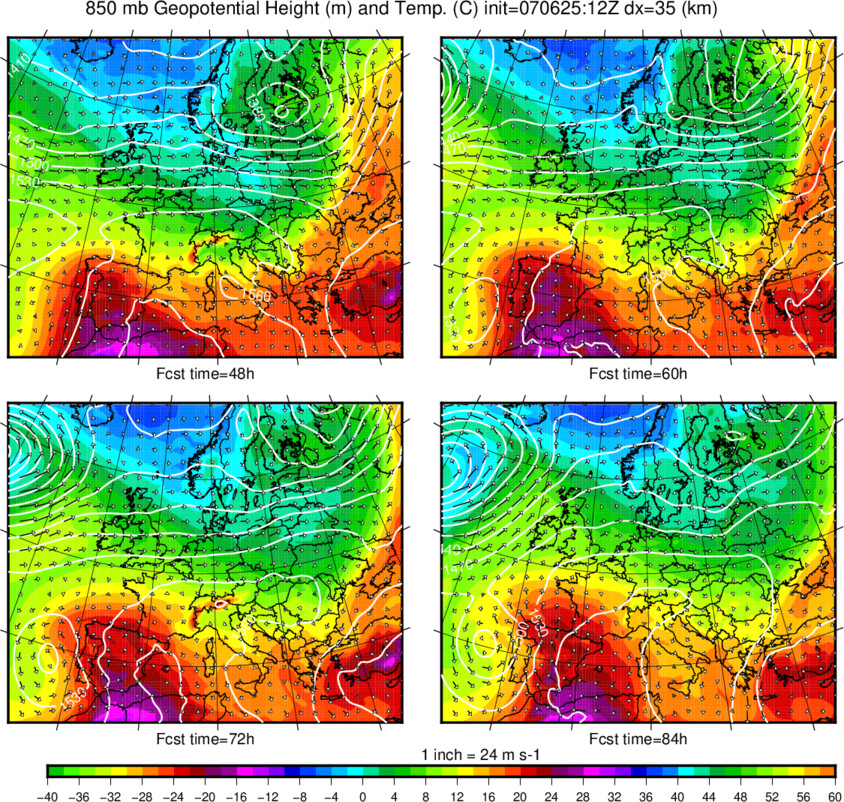
| 850 Hgt, WindV, Tair | 0-36h | 48-84h | 0-36h | 48-84h |
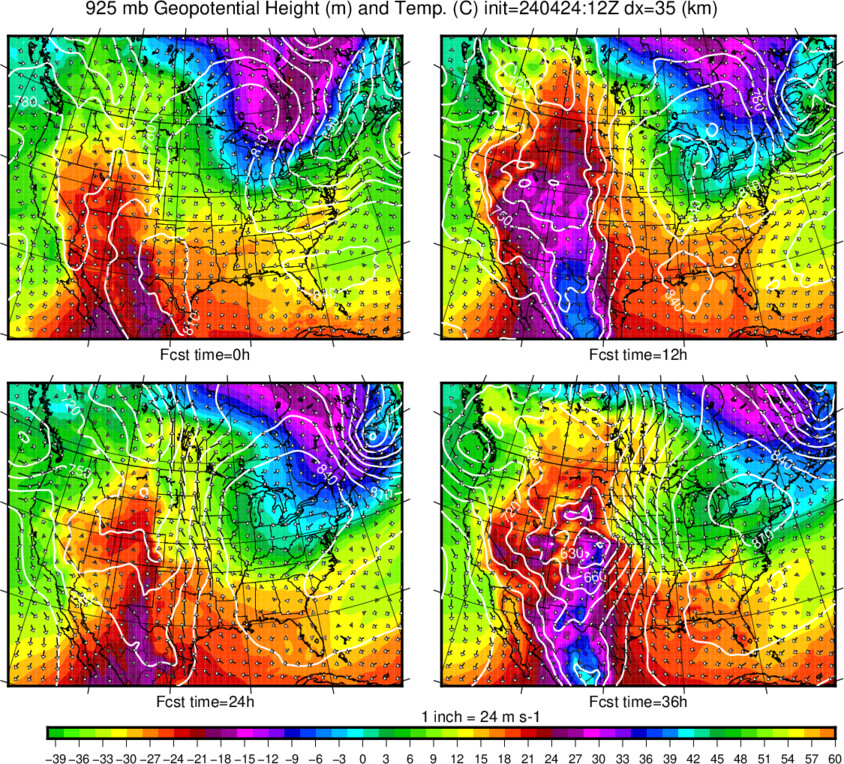
| 925 Hgt, WindV, Tair | 0-36h | 48-84h | 0-36h | 48-84h |
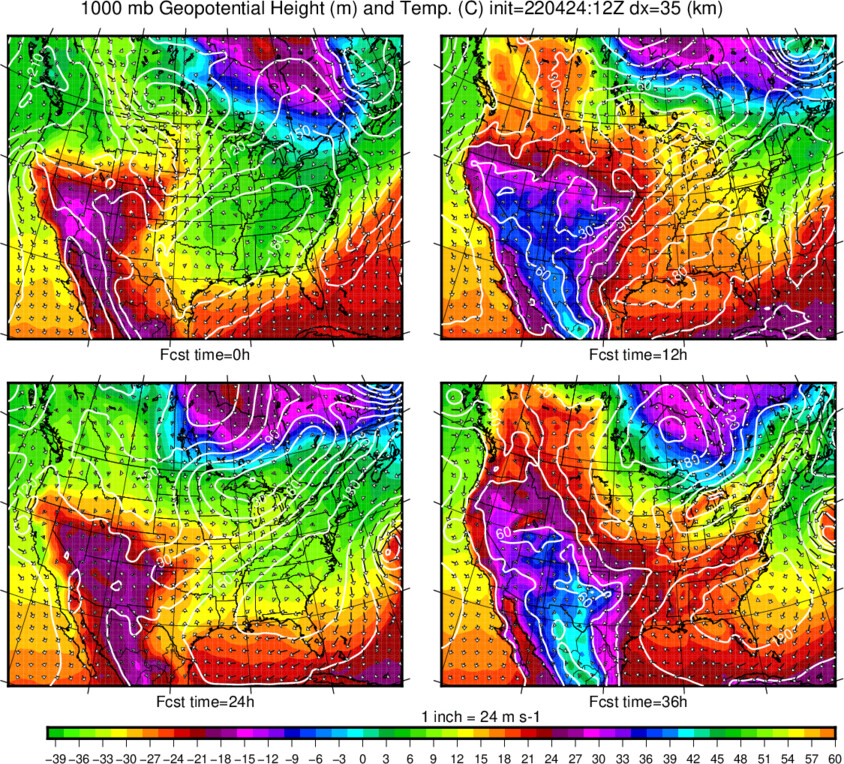
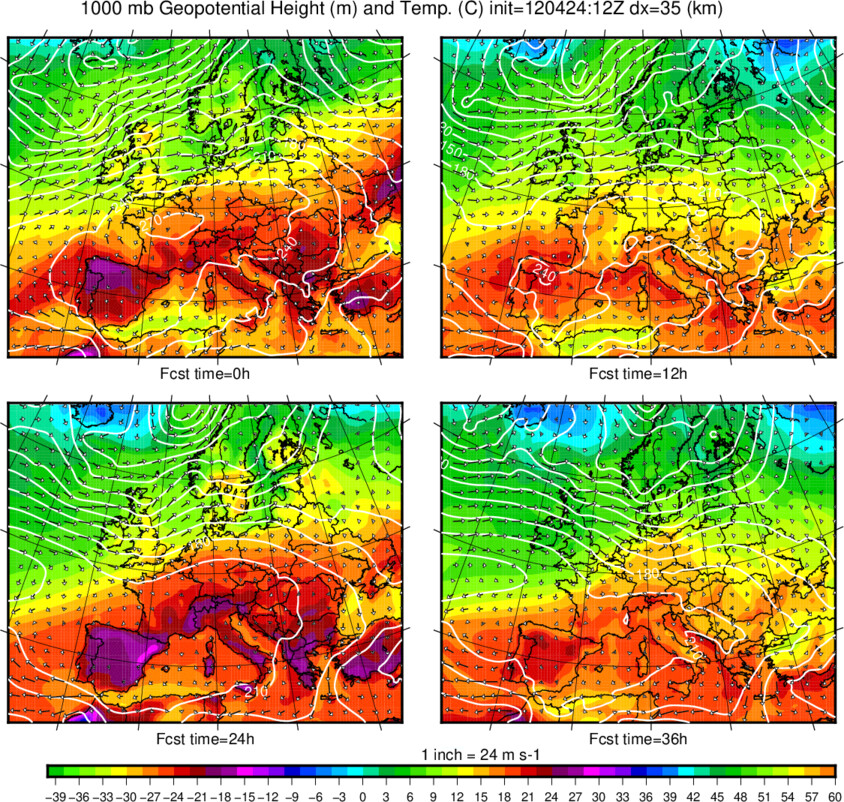
| 1000 Hgt, WindV, Tair | 0-36h | 48-84h | 0-36h | 48-84h |
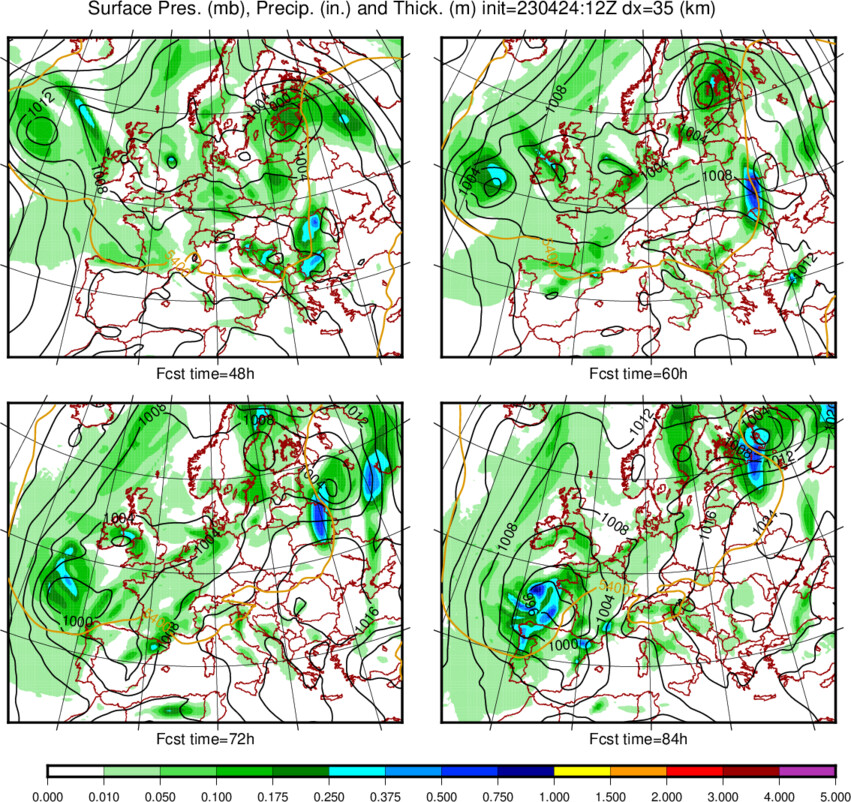
| PSurf, Total Precip, 500-1000 Thck | 0-36h | 48-84h | 0-36h | 48-84h |
| PSurf, 500mb Hgt | 0-36h | 48-84h | 0-36h | 48-84h |
| PSurf, Convct Precip | 0-36h | 48-84h | 0-36h | 48-84h |
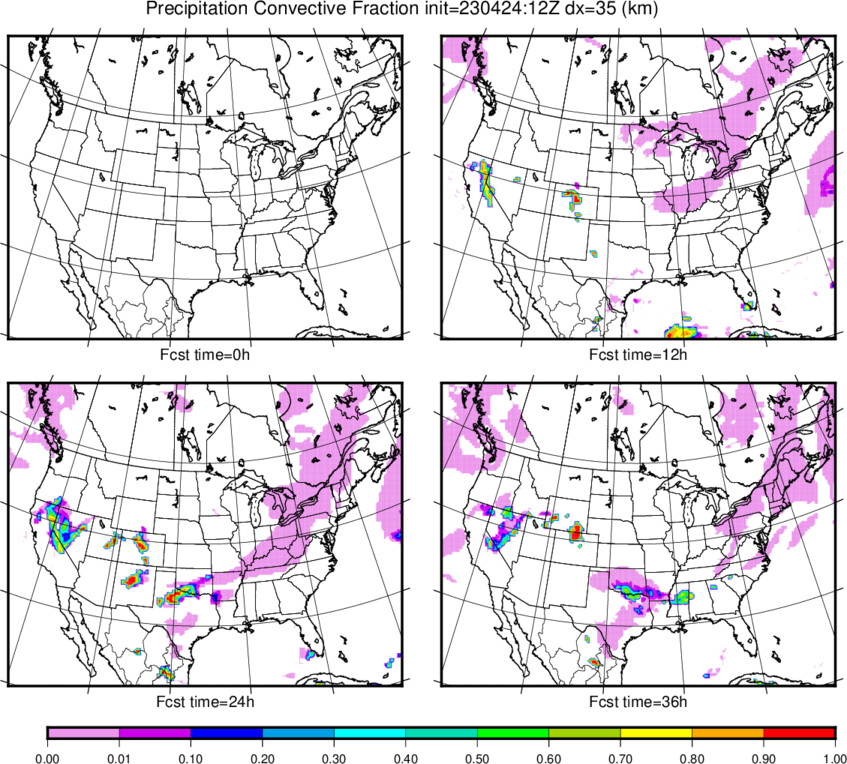
| PSurf, Convect Precip Frac | 0-36h | 48-84h | 0-36h | 48-84h |
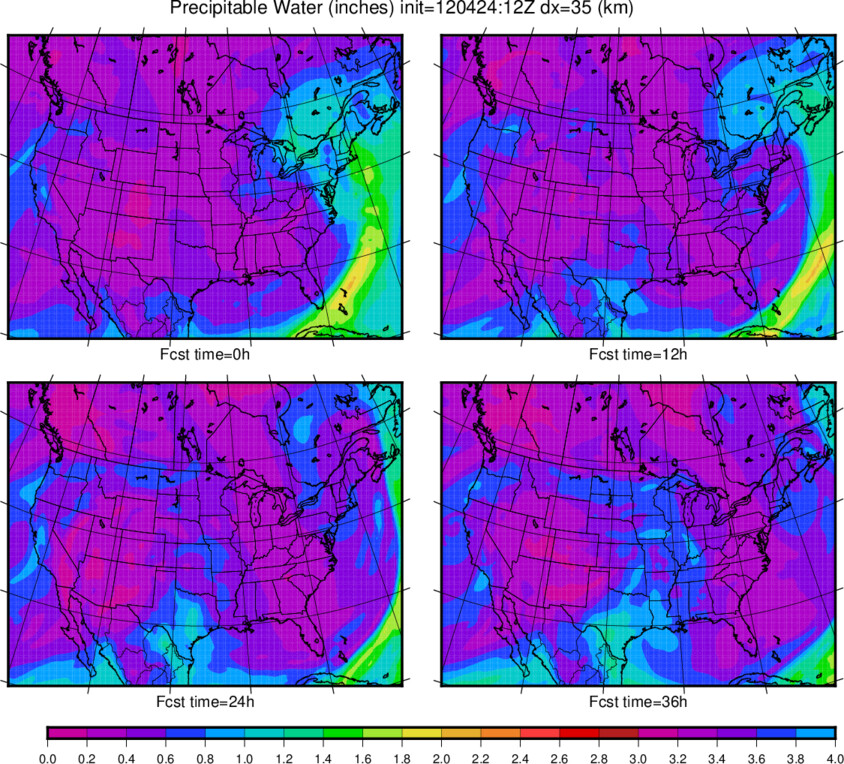
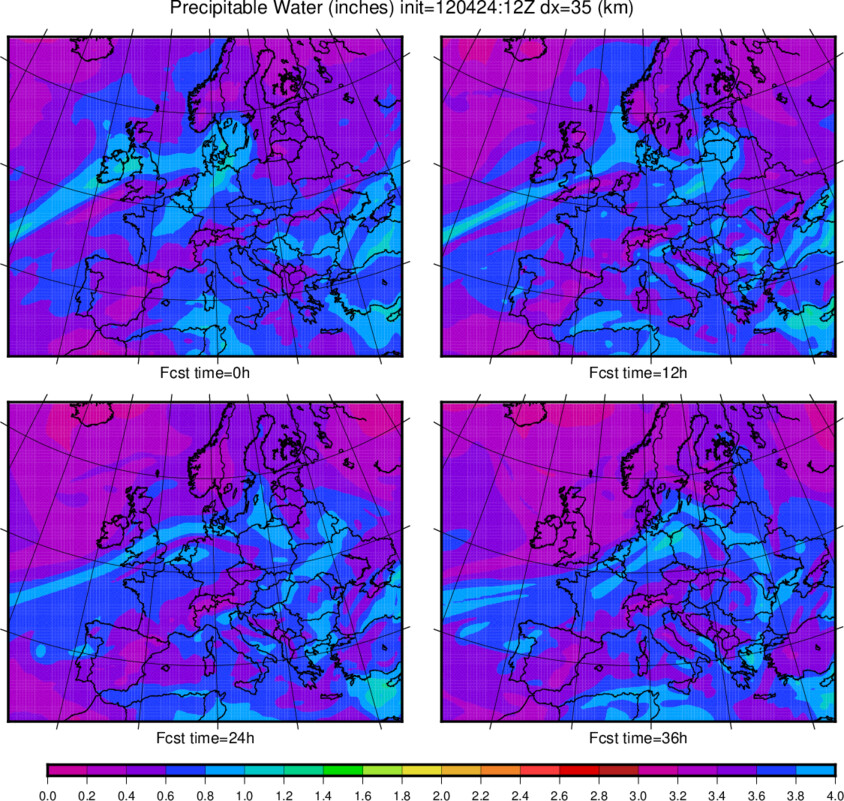
| Precipitable Water | 0-36h | 48-84h | 0-36h | 48-84h |
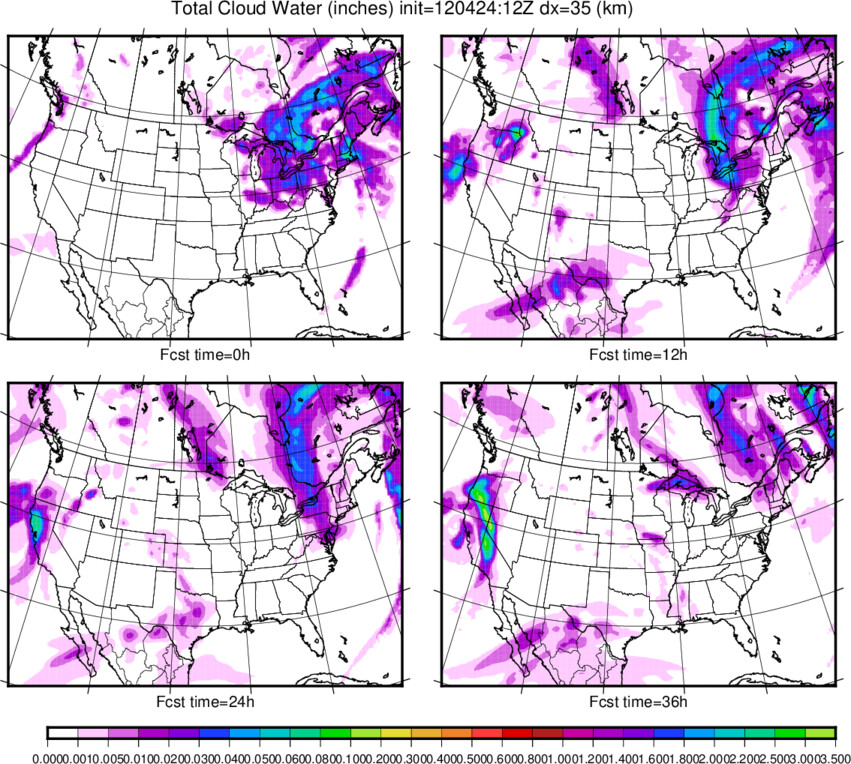
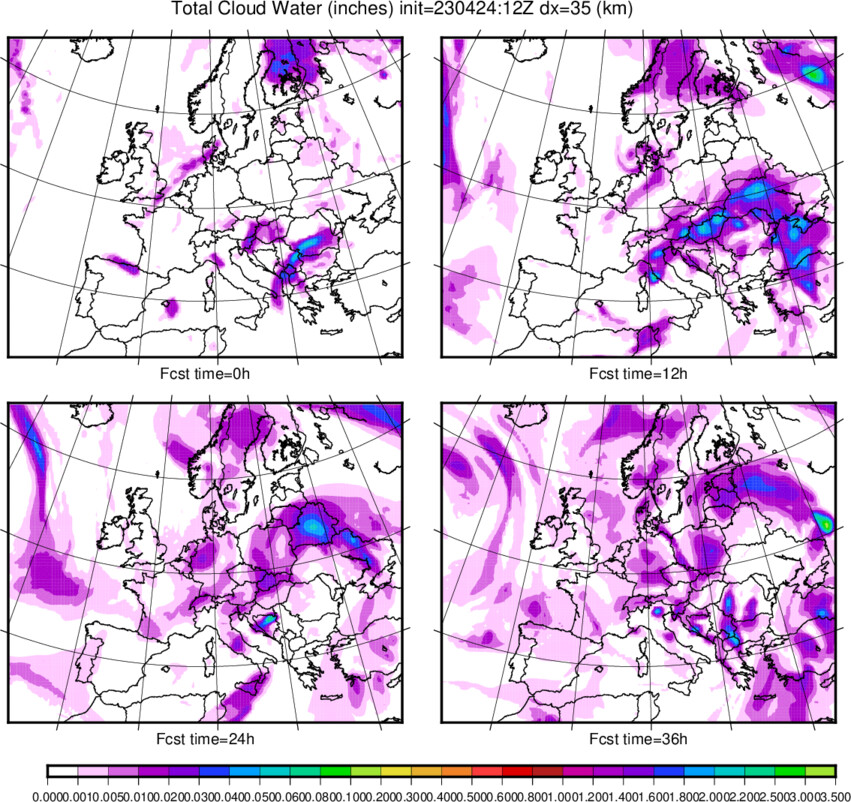
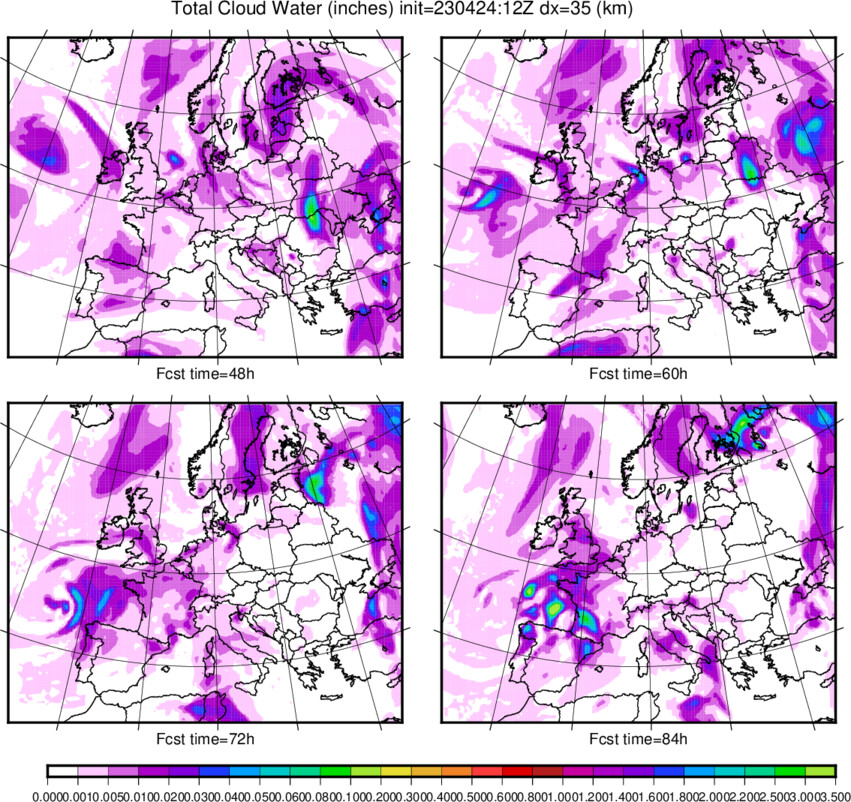
| Cloud Water | 0-36h | 48-84h | 0-36h | 48-84h |
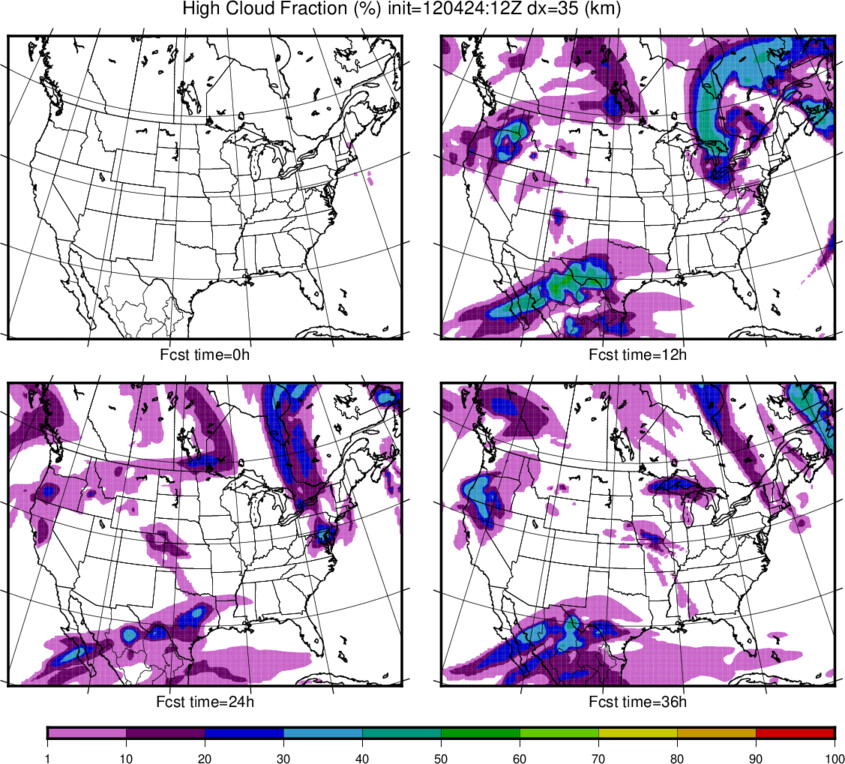
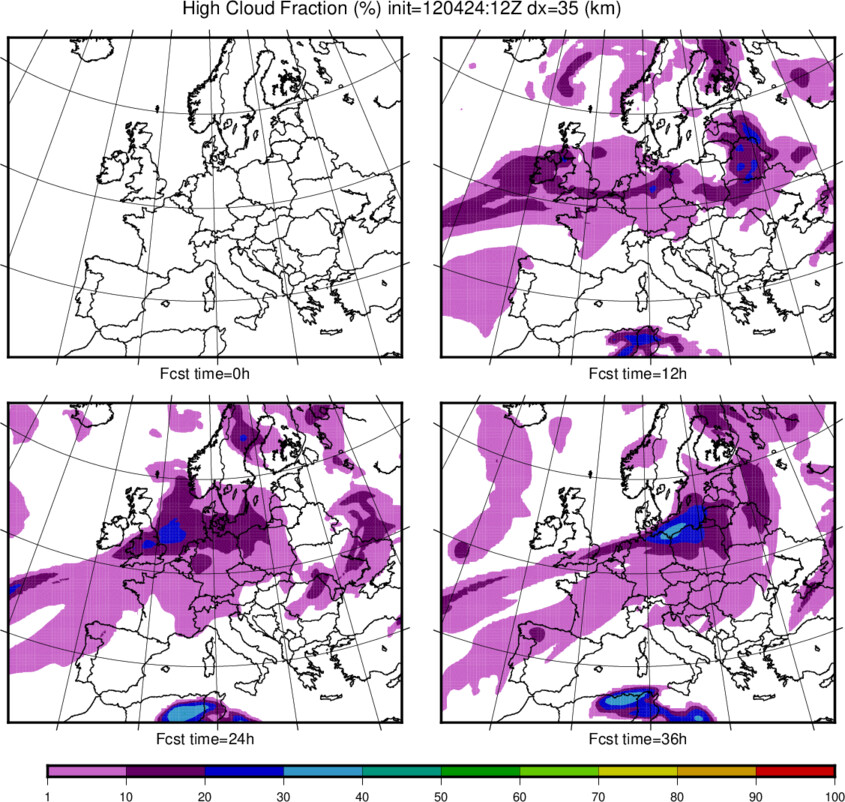
| High level Clouds (fraction) | 0-36h | 48-84h | 0-36h | 48-84h |
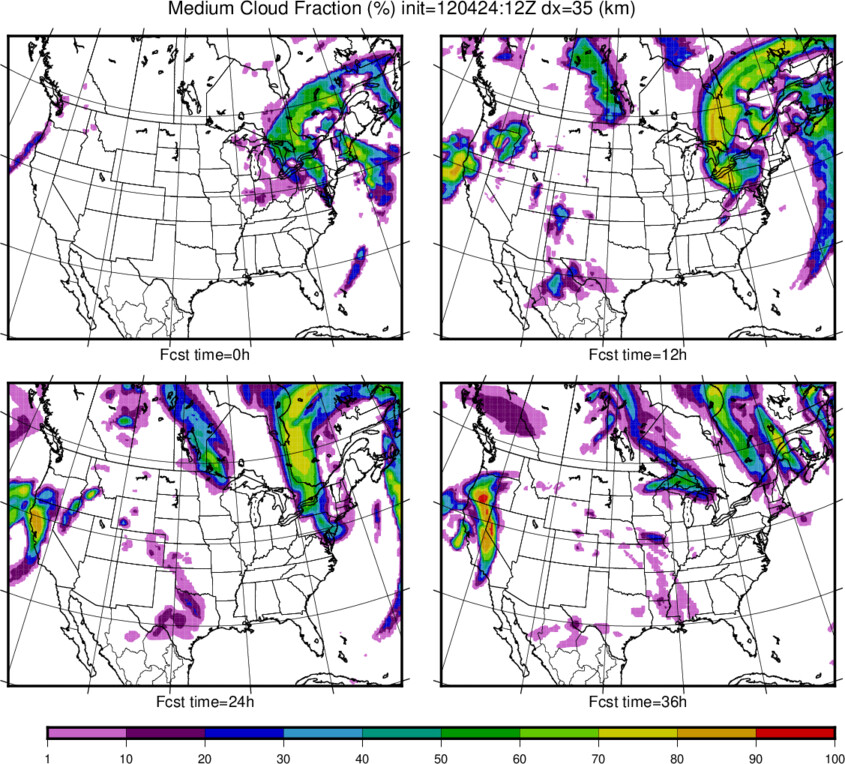
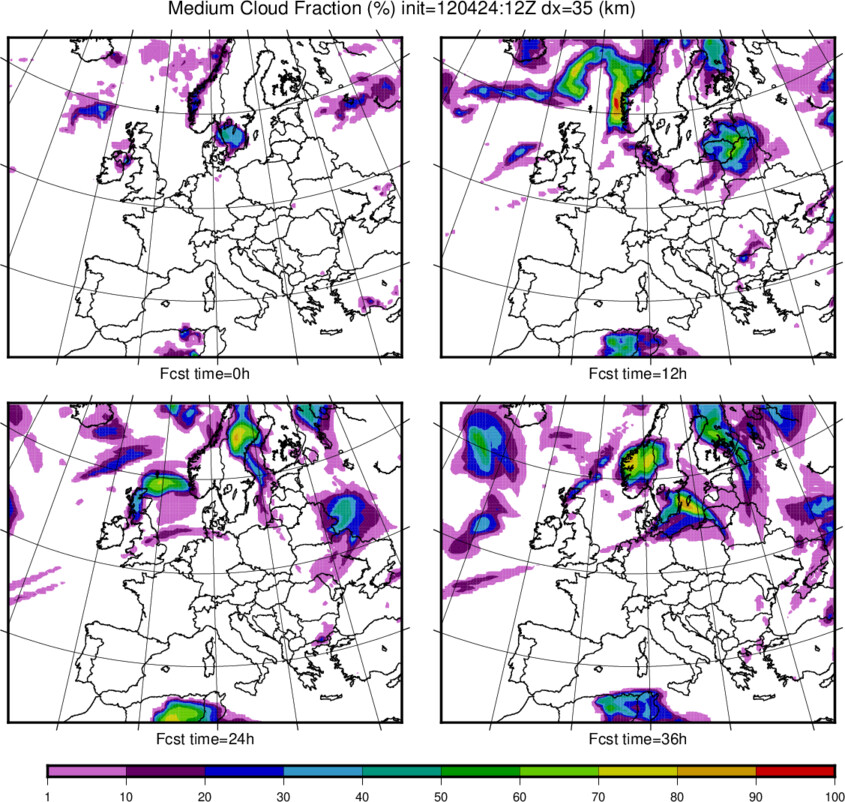
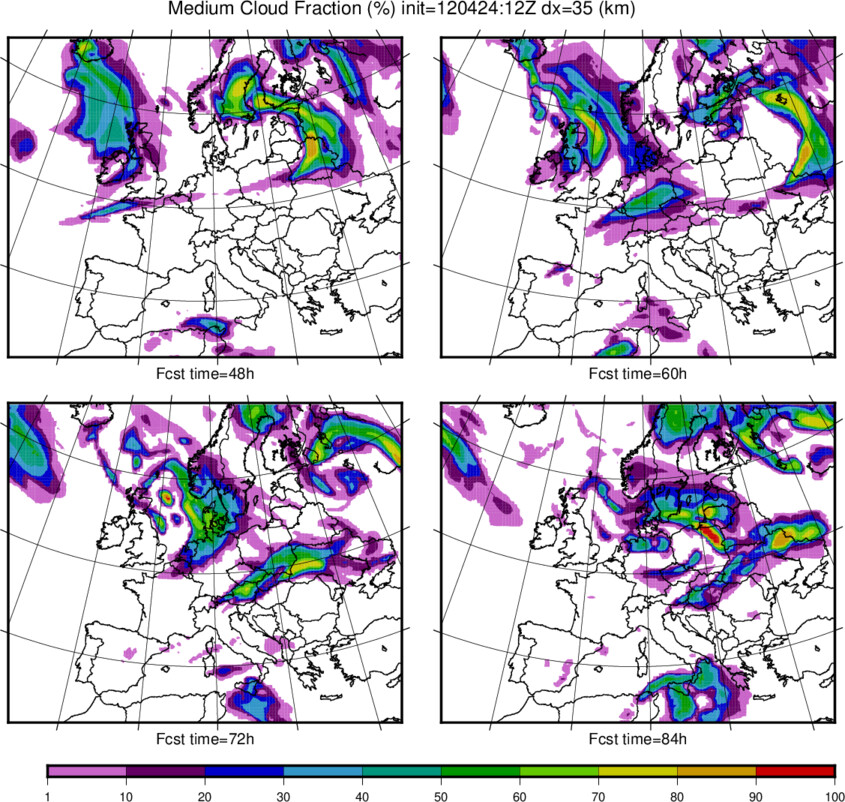
| Medium level Clouds (fraction) | 0-36h | 48-84h | 0-36h | 48-84h |
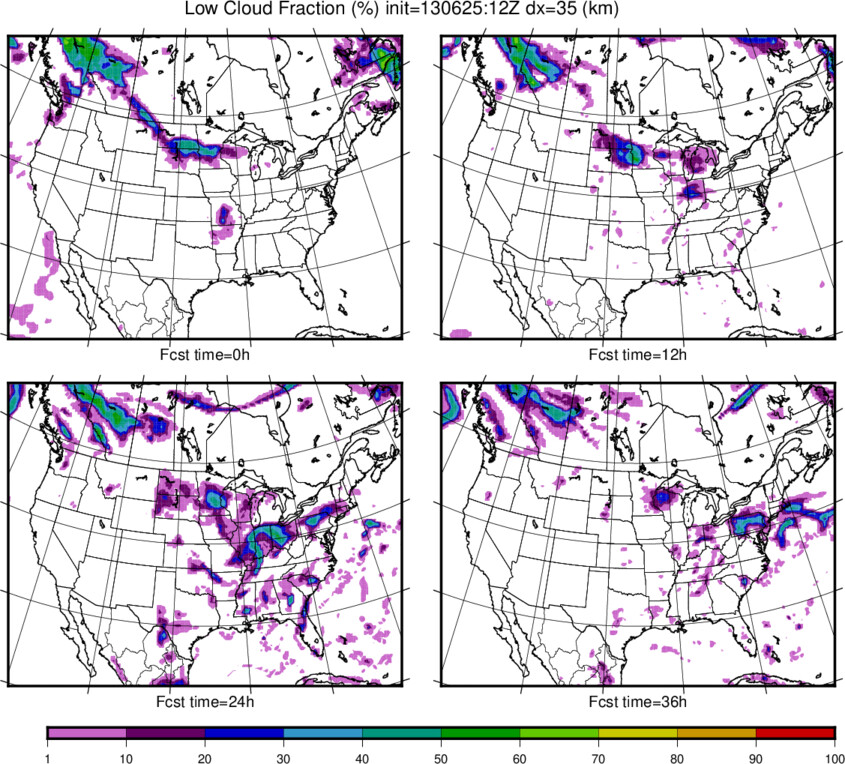
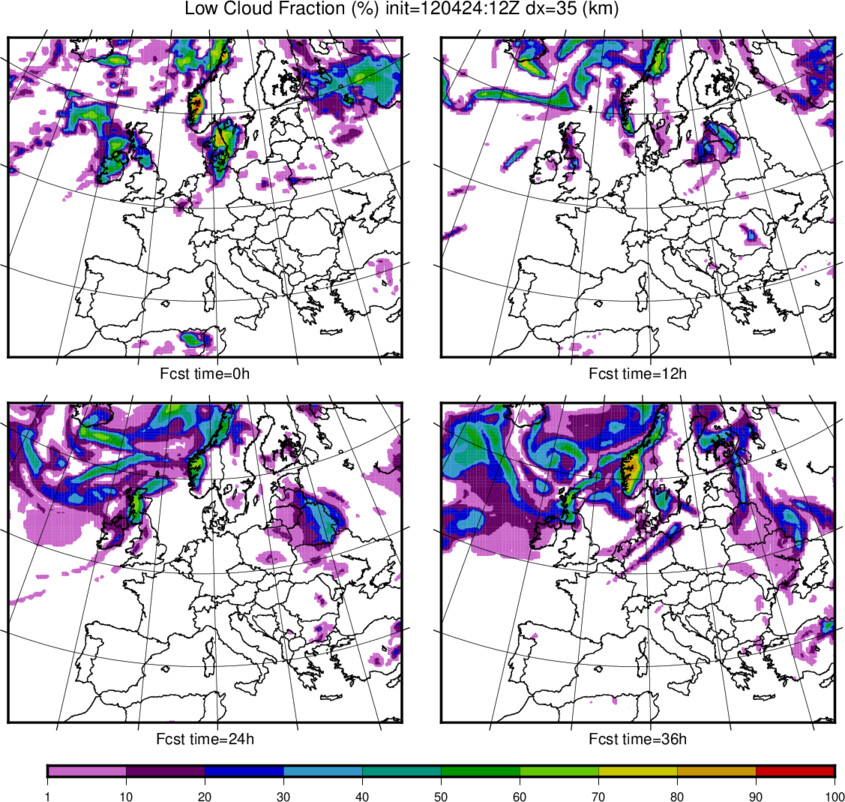
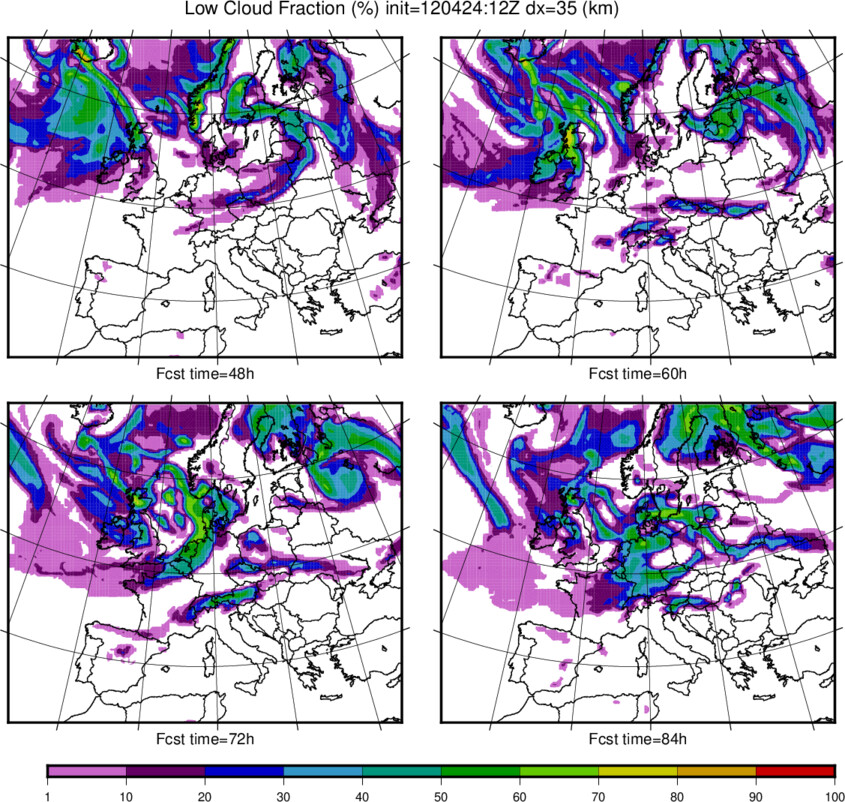
| Low level Clouds (fraction) | 0-36h | 48-84h | 0-36h | 48-84h |
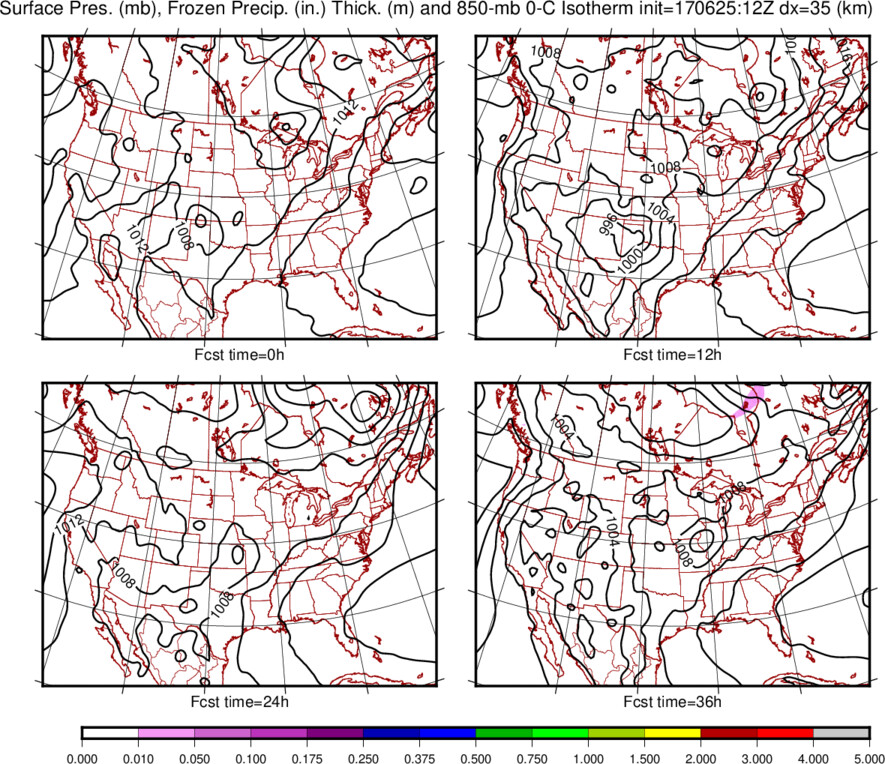
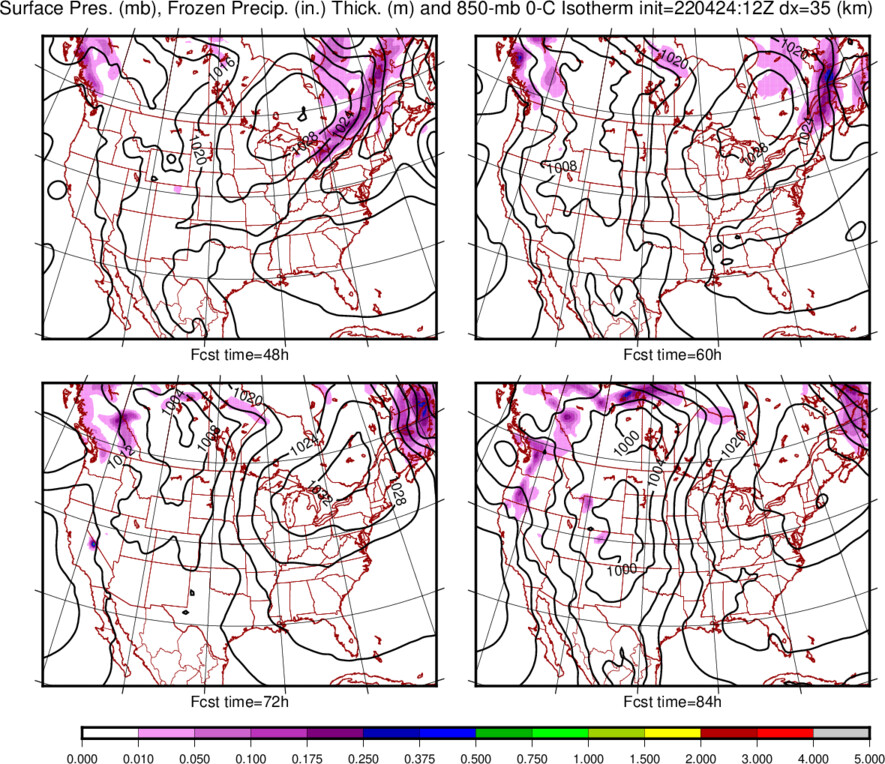
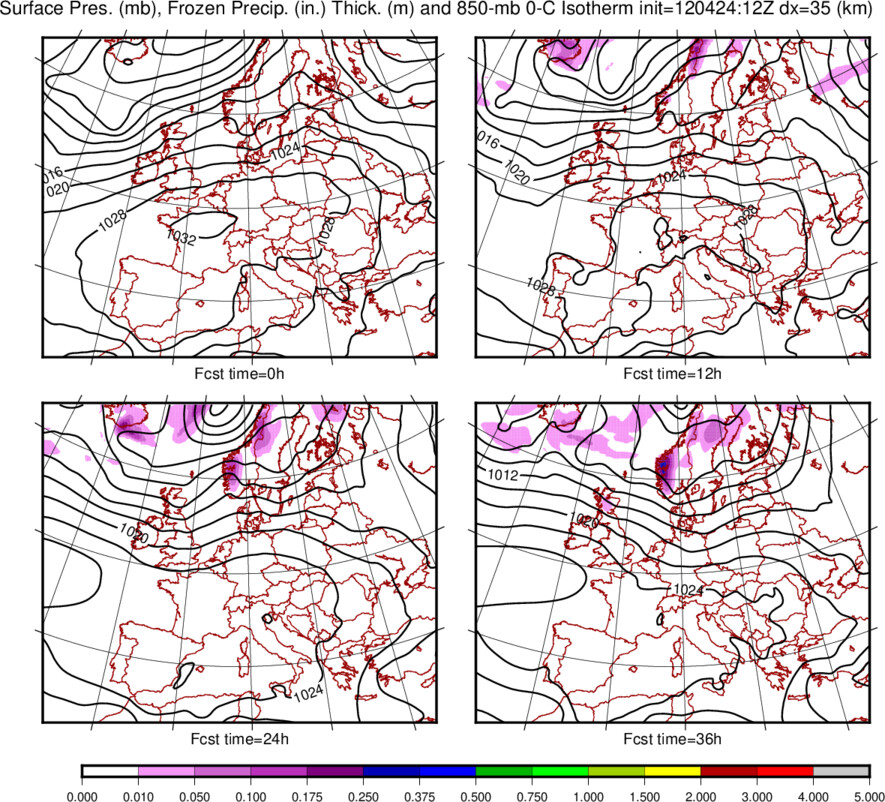
| PSurf, Froz Precip, 5400m Thck, 850mb-0deg | 0-36h | 48-84h | 0-36h | 48-84h |
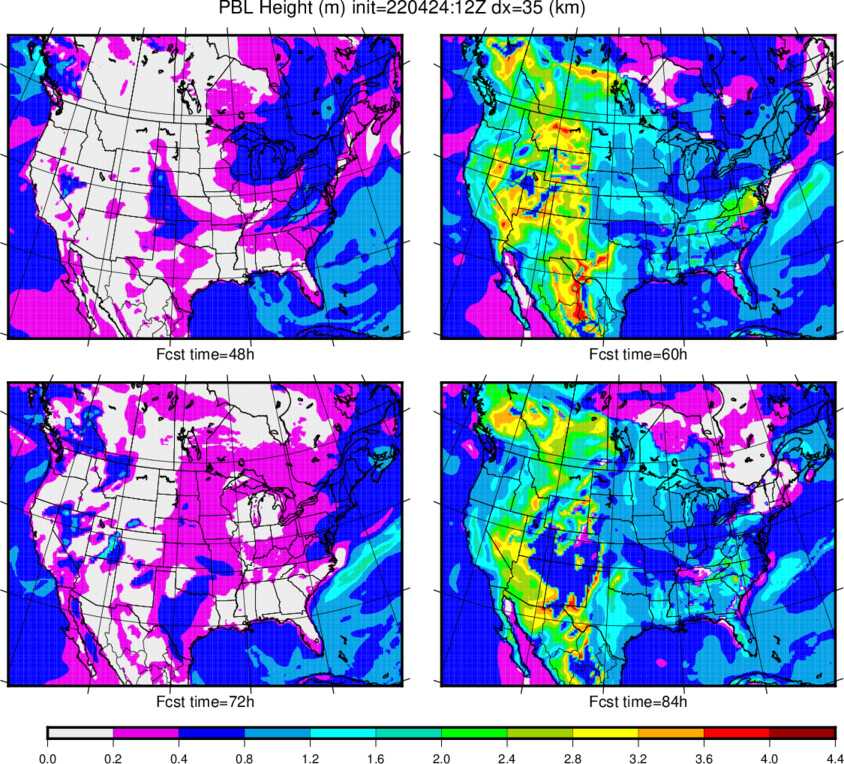
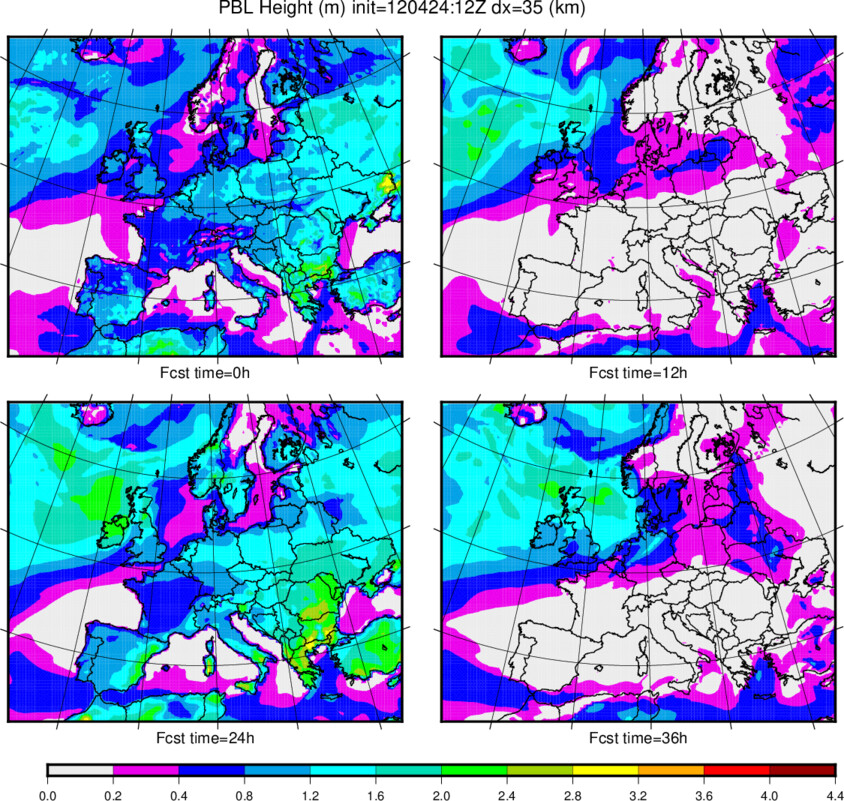
| PBLz | 0-36h | 48-84h | 0-36h | 48-84h |
| 300 mb TKE | 0-36h | 48-84h | 0-36h | 48-84h |
| 500 mb TKE | 0-36h | 48-84h | 0-36h | 48-84h |
| 700 mb TKE | 0-36h | 48-84h | 0-36h | 48-84h |
| 850 mb TKE | 0-36h | 48-84h | 0-36h | 48-84h |
| 925 mb TKE | 0-36h | 48-84h | 0-36h | 48-84h |
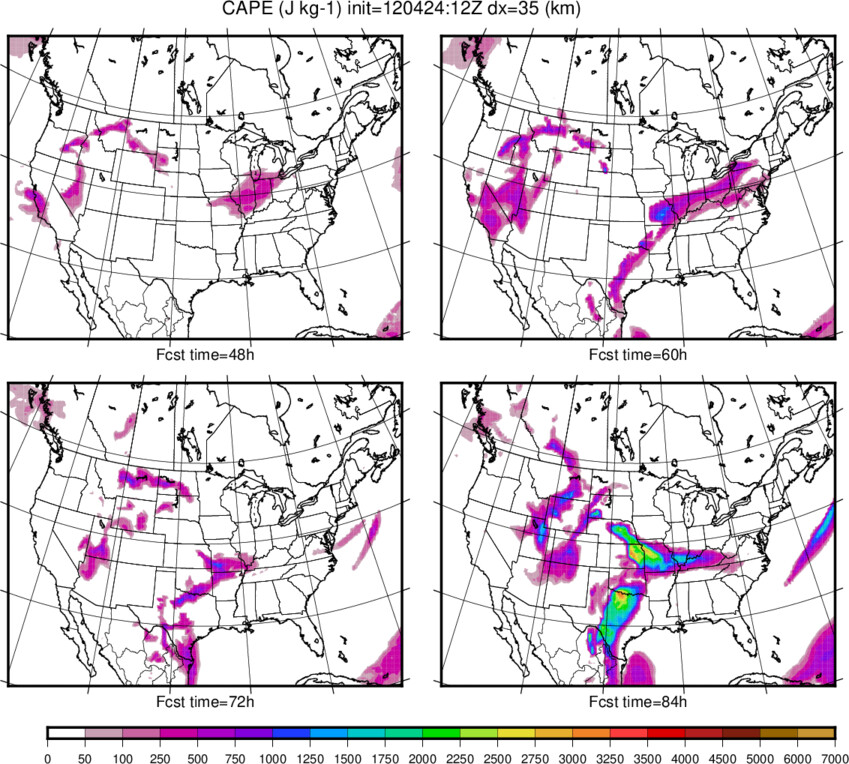
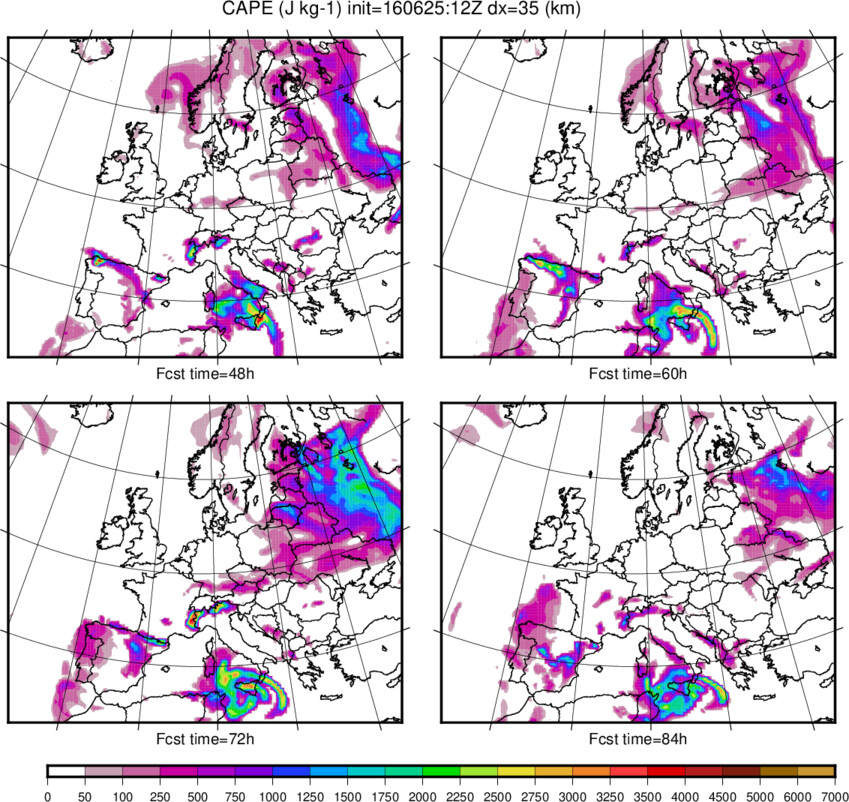
| CAPE | 0-36h | 48-84h | 0-36h | 48-84h |
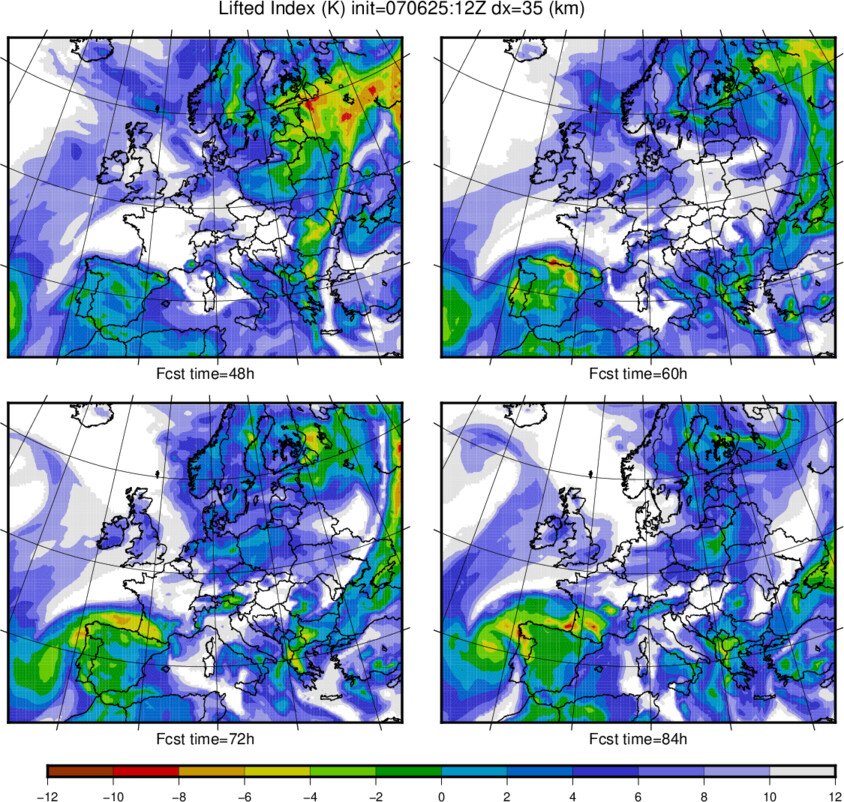
| LIFTed Index | 0-36h | 48-84h | 0-36h | 48-84h |
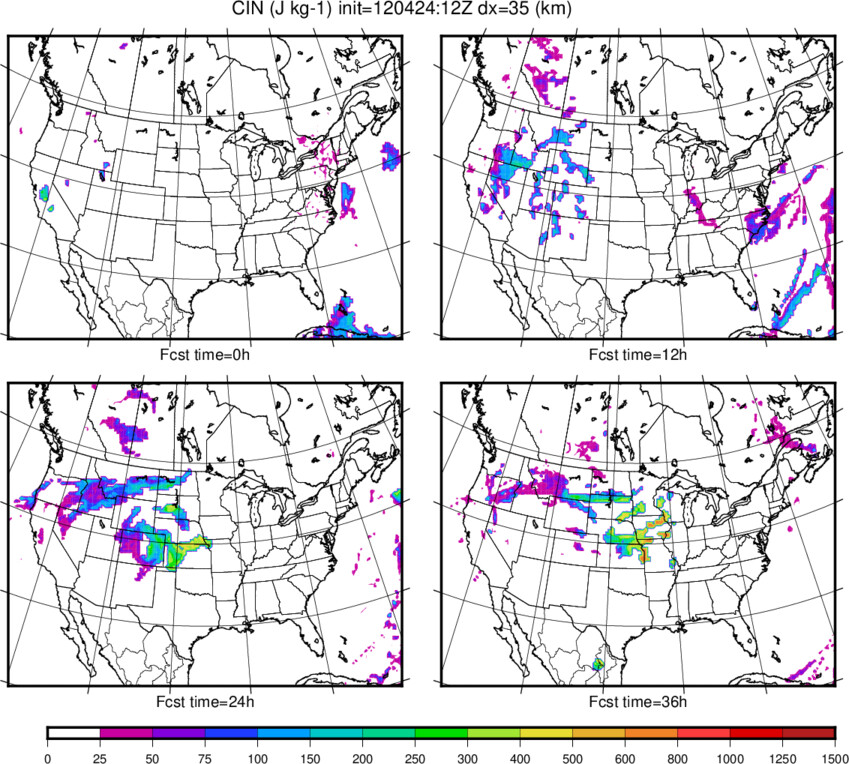
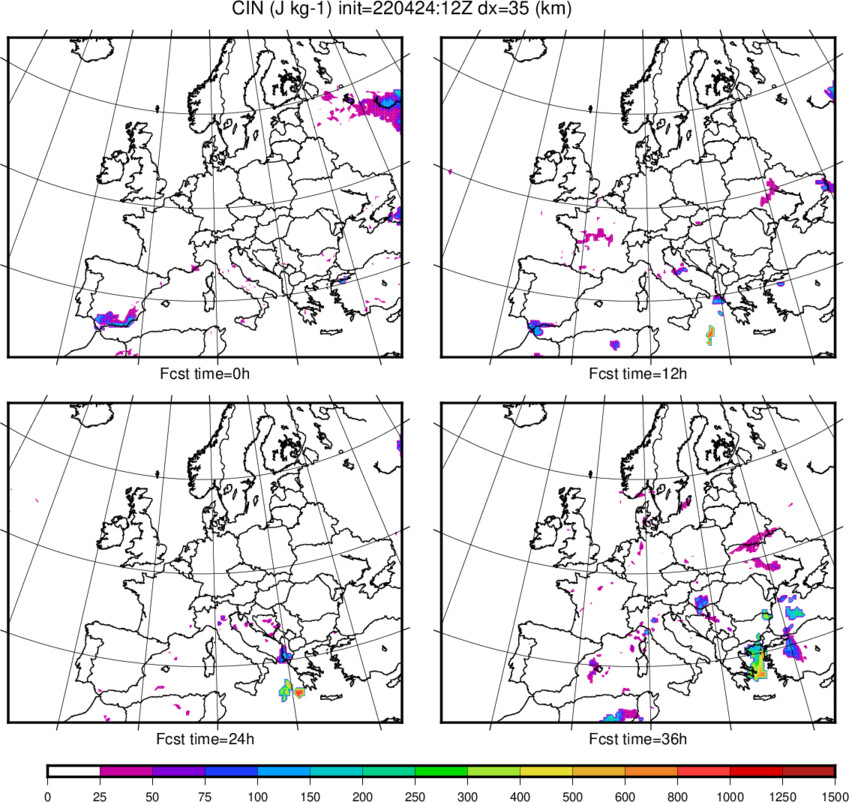
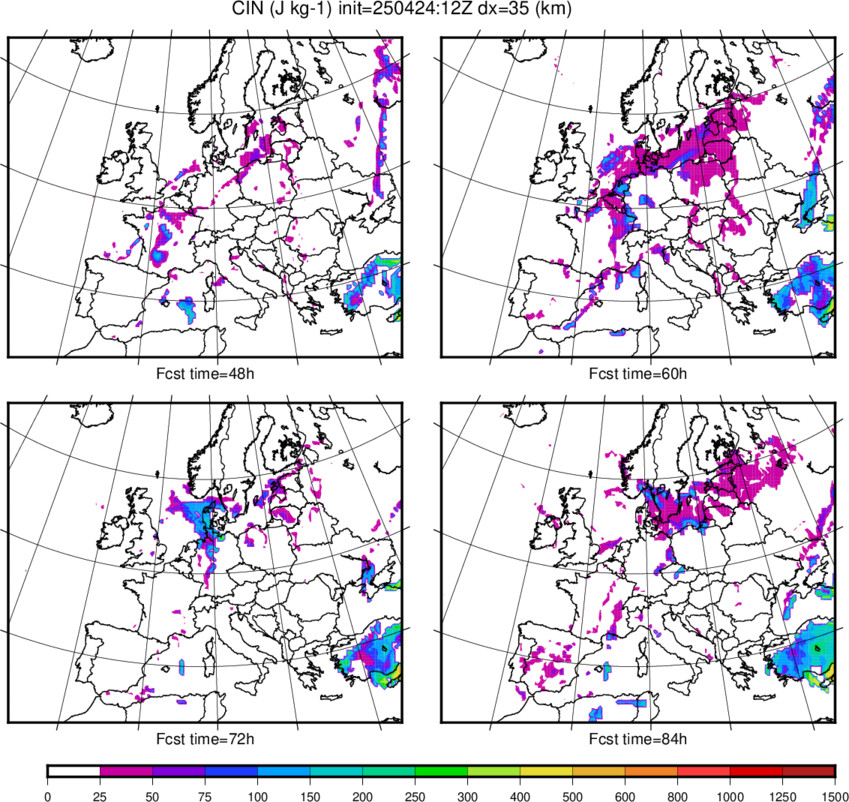
| CIN | 0-36h | 48-84h | 0-36h | 48-84h |
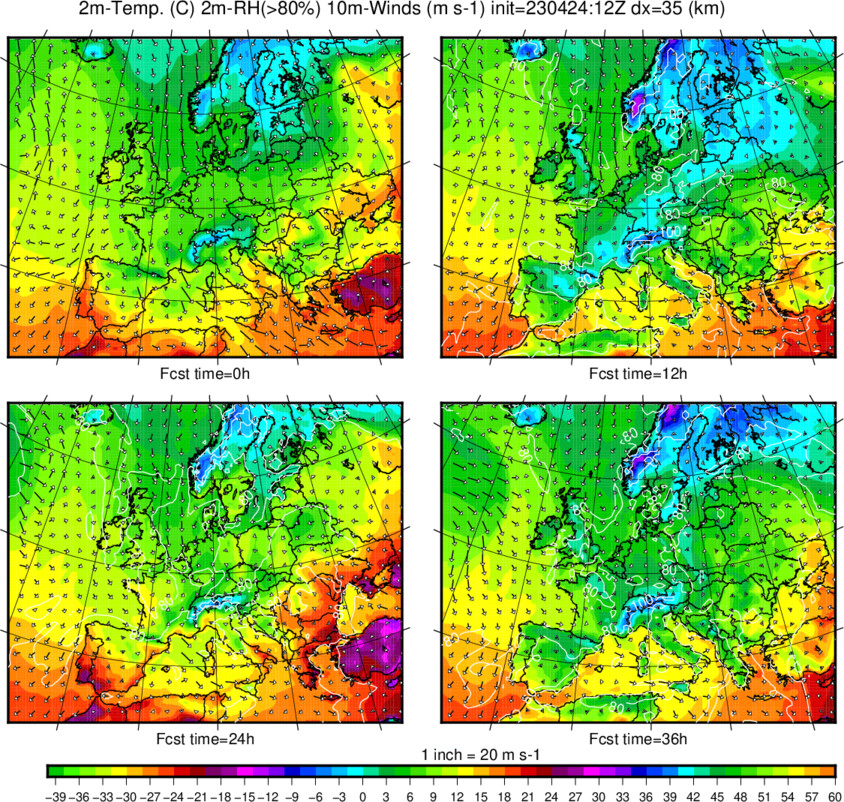
| Near surface (screen level) Tair (2 m) and WindV (10 m) | 0-36h | 48-84h | 0-36h | 48-84h |
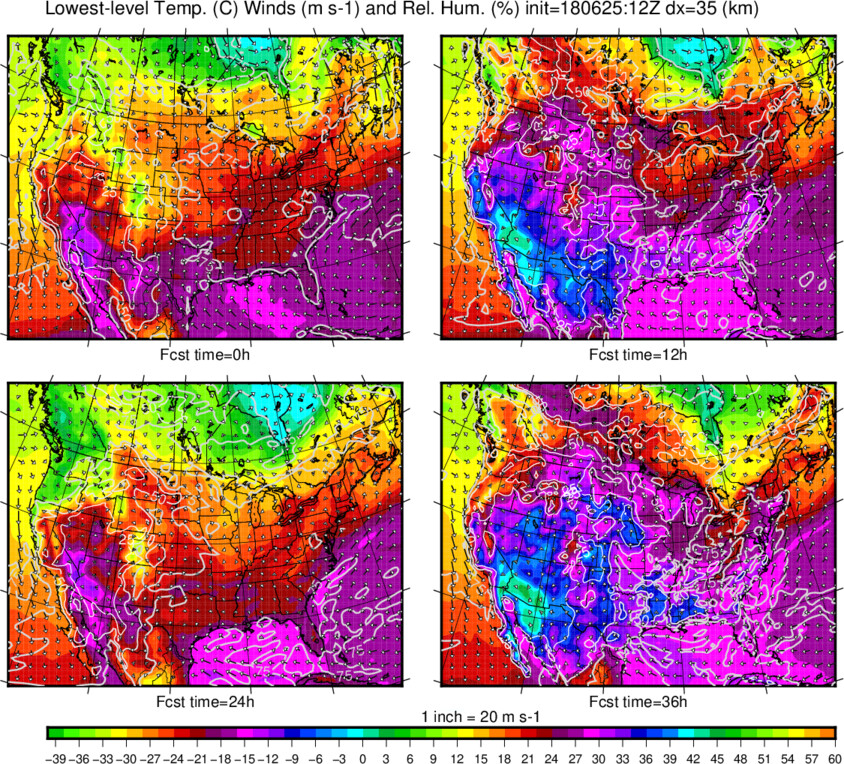
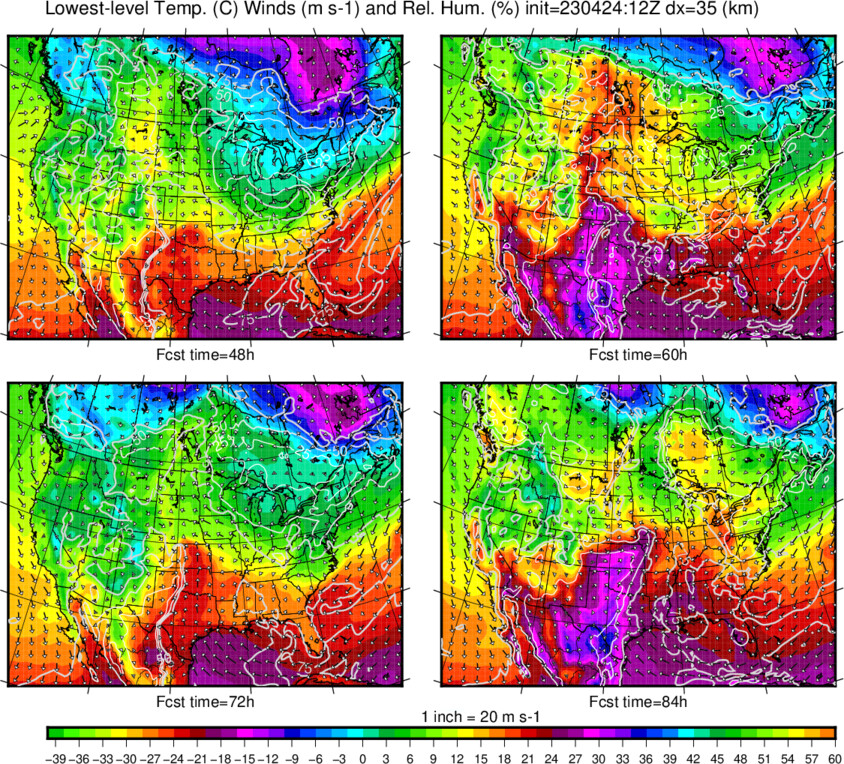
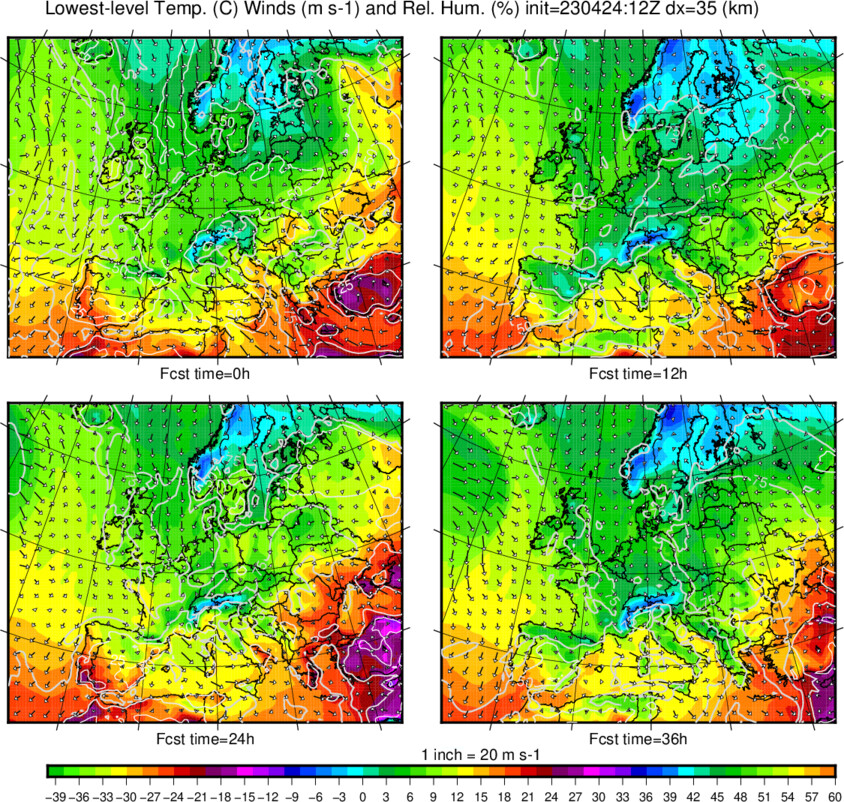
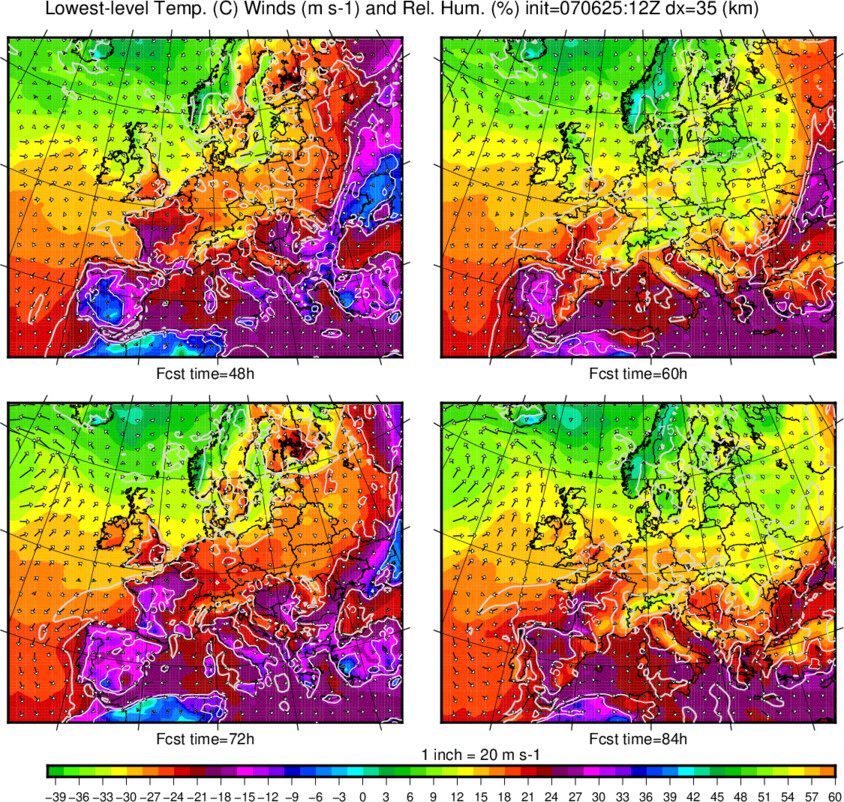
| Lowest model level Tair, and Wind and RH | 0-36h | 48-84h | 0-36h | 48-84h |
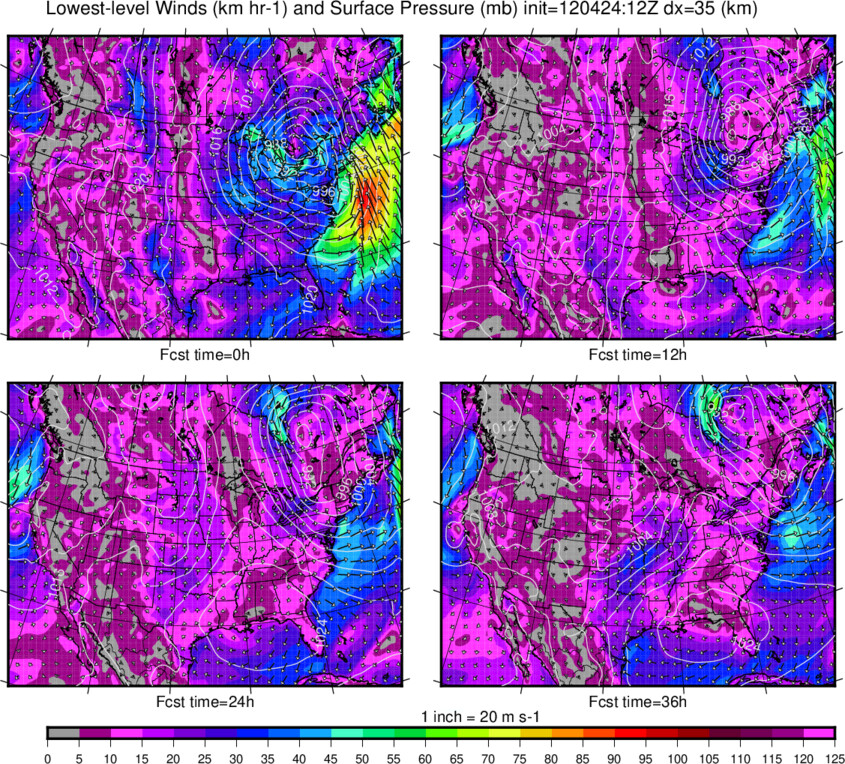
| Lowest model level Wind Speed | 0-36h | 48-84h | 0-36h | 48-84h |
| Surface Variables: |
||||
| TSurf | 0-36h | 48-84h | 0-36h | 48-84h |
| Evapc (cummulative evaporation) | 0-36h | 48-84h | 0-36h | 48-84h |
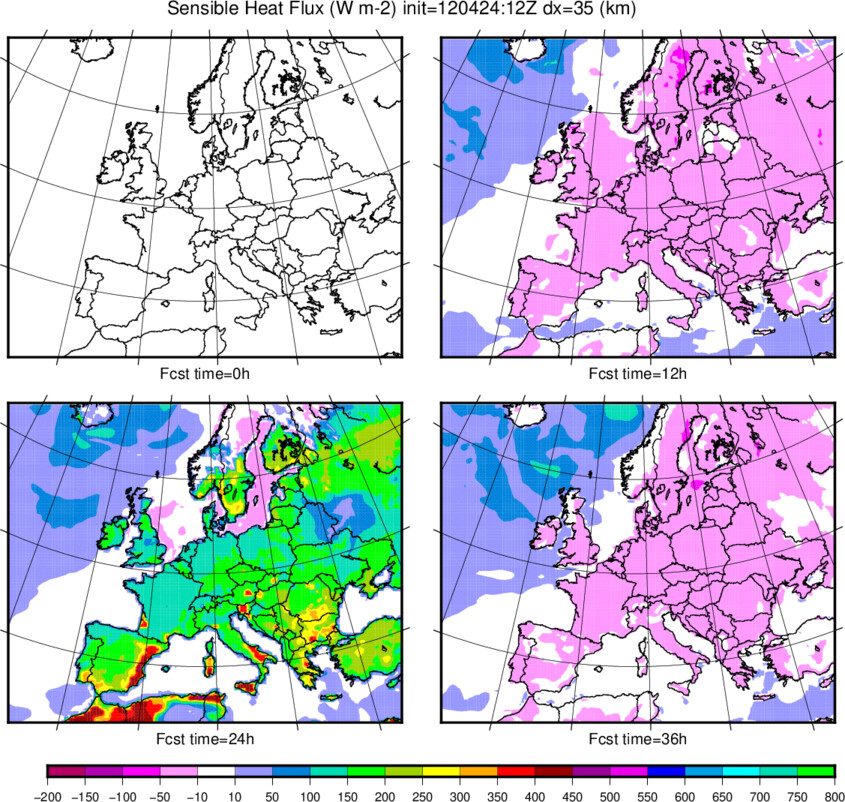
| Qh (surface sensible heat flux) | 0-36h | 48-84h | 0-36h | 48-84h |
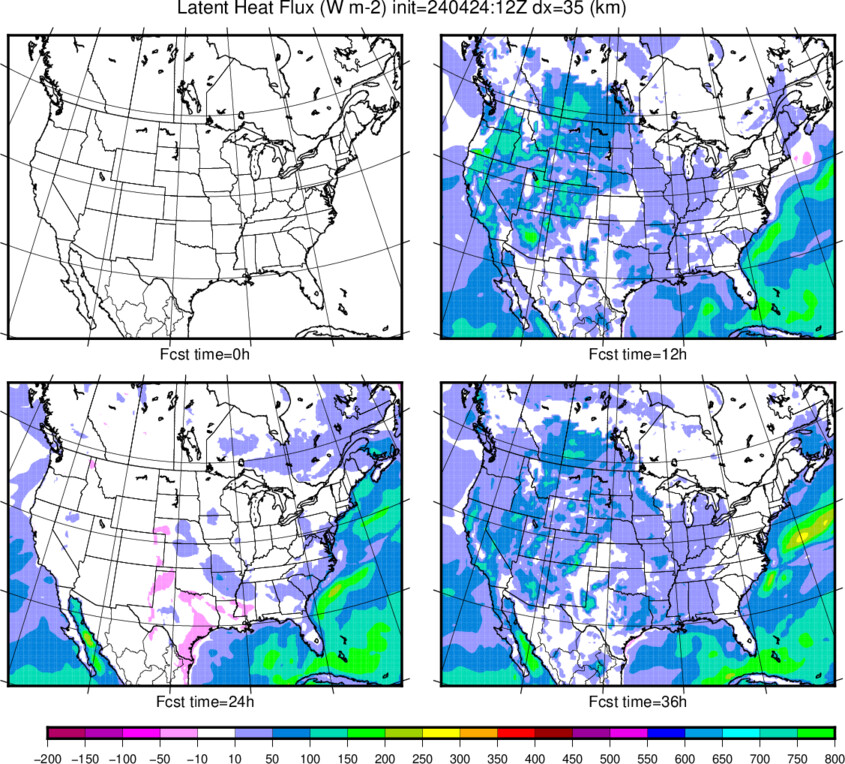
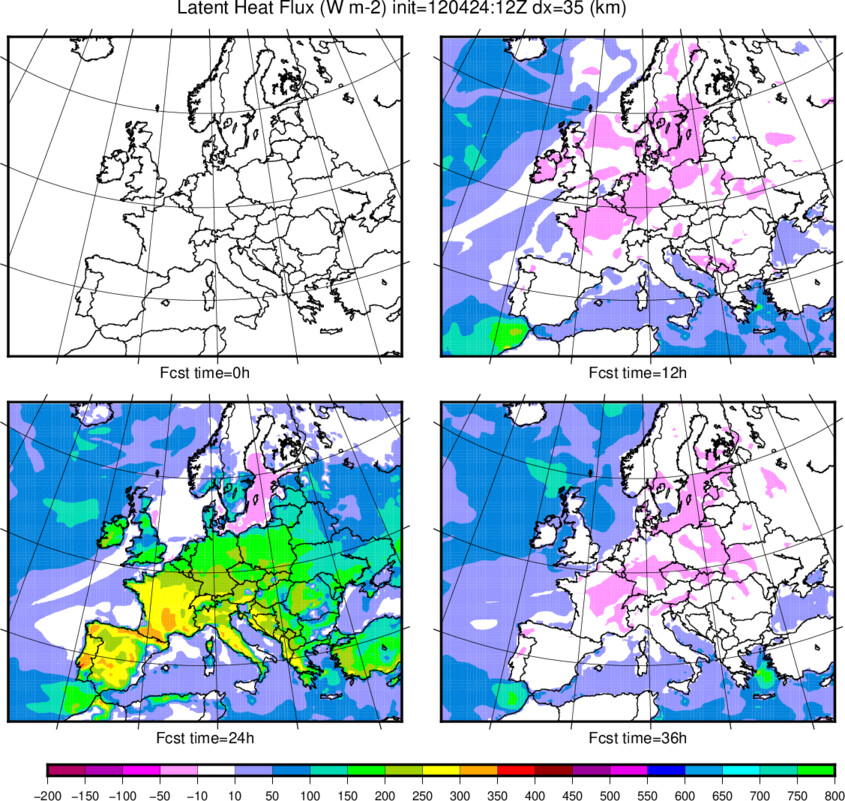
| Ql (surface latent heat flux) | 0-36h | 48-84h | 0-36h | 48-84h |
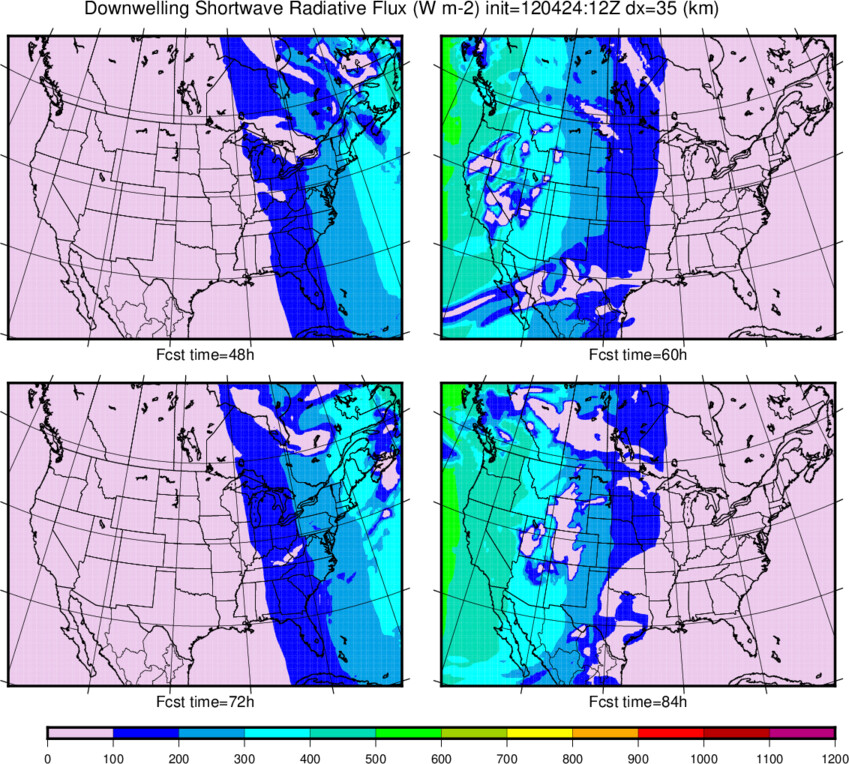
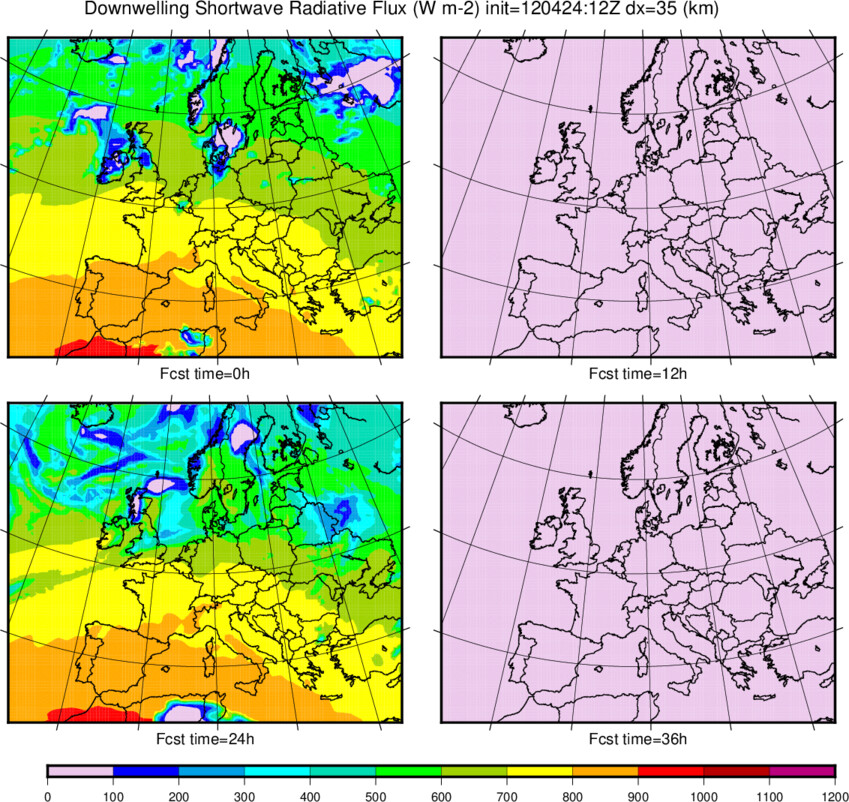
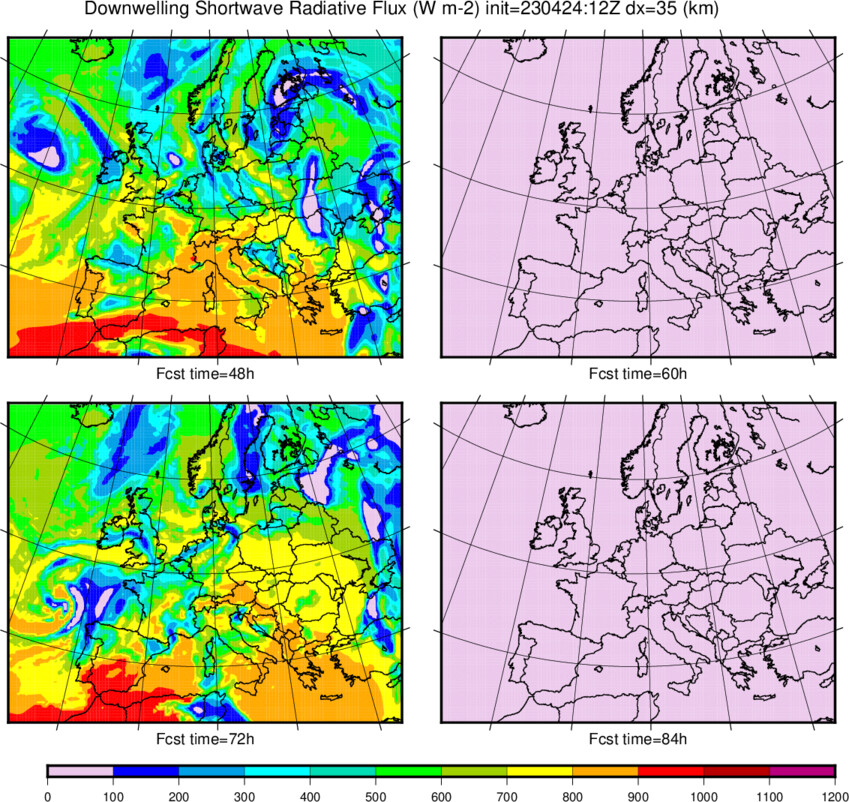
| SWdown | 0-36h | 48-84h | 0-36h | 48-84h |
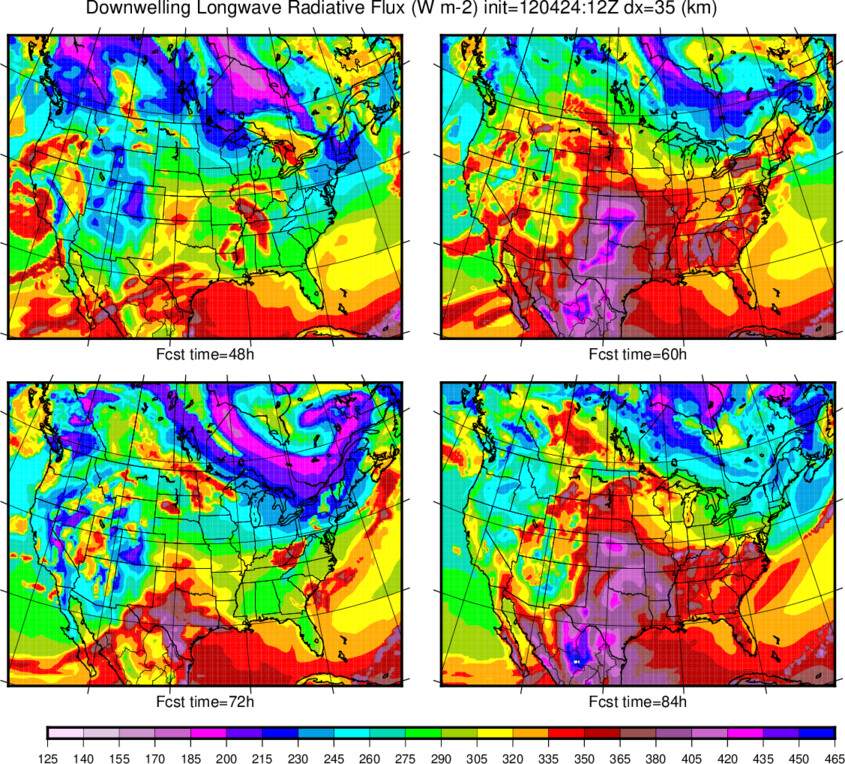
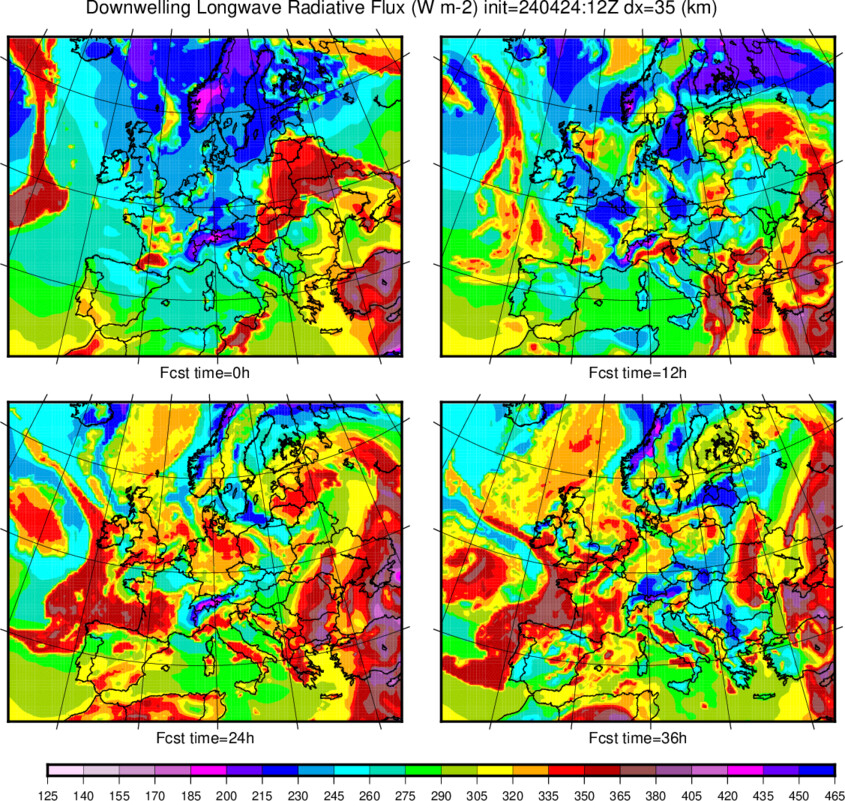
| LWdown | 0-36h | 48-84h | 0-36h | 48-84h |
| SnowF | 0-36h | 48-84h | 0-36h | 48-84h |
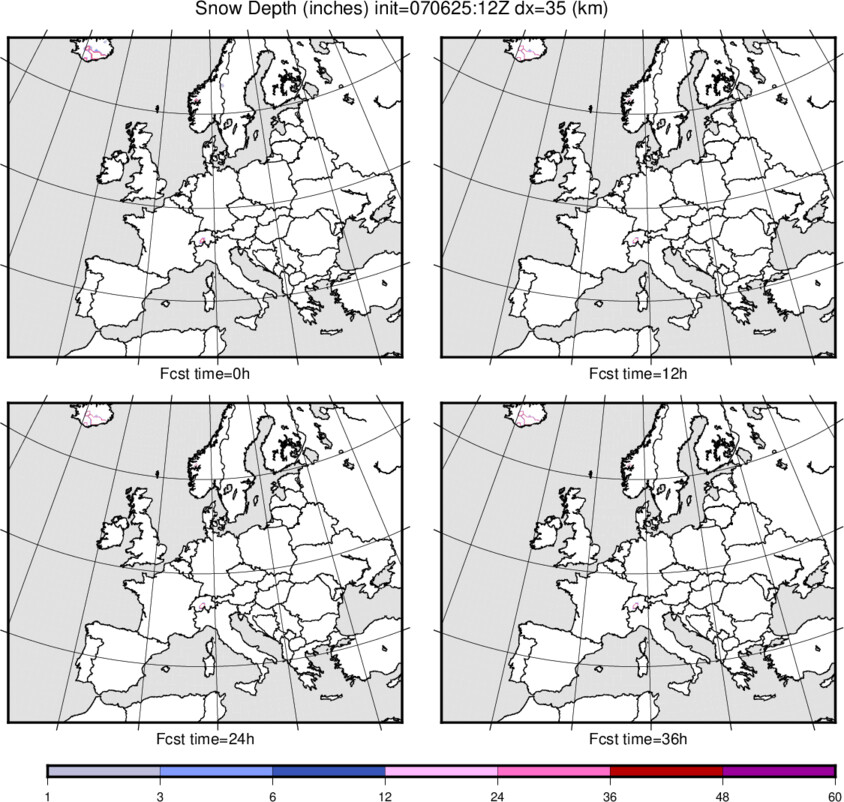
| SnowDepth | 0-36h | 48-84h | 0-36h | 48-84h |
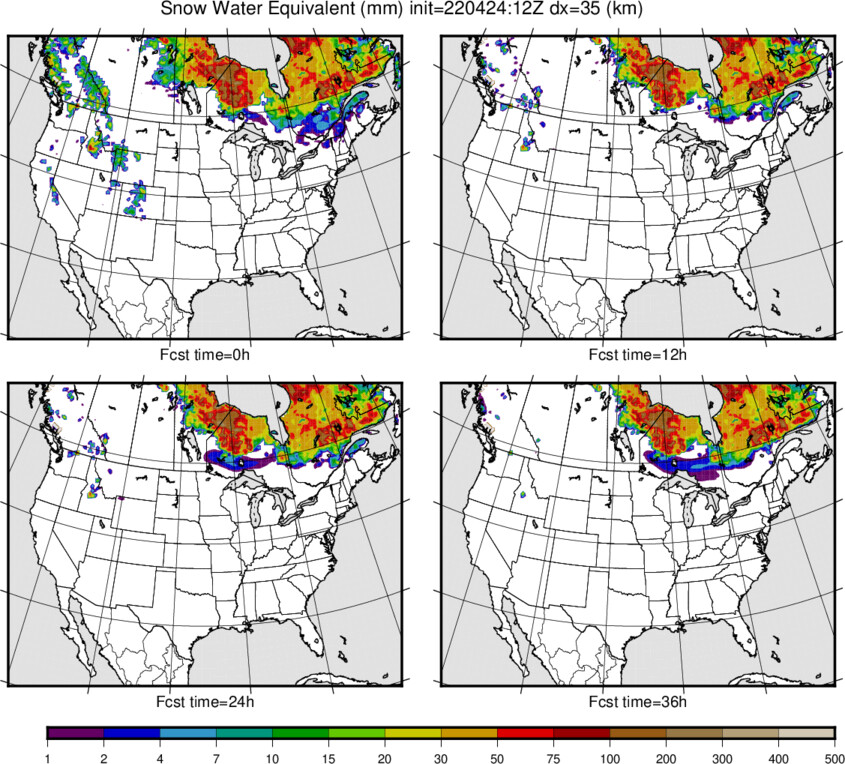
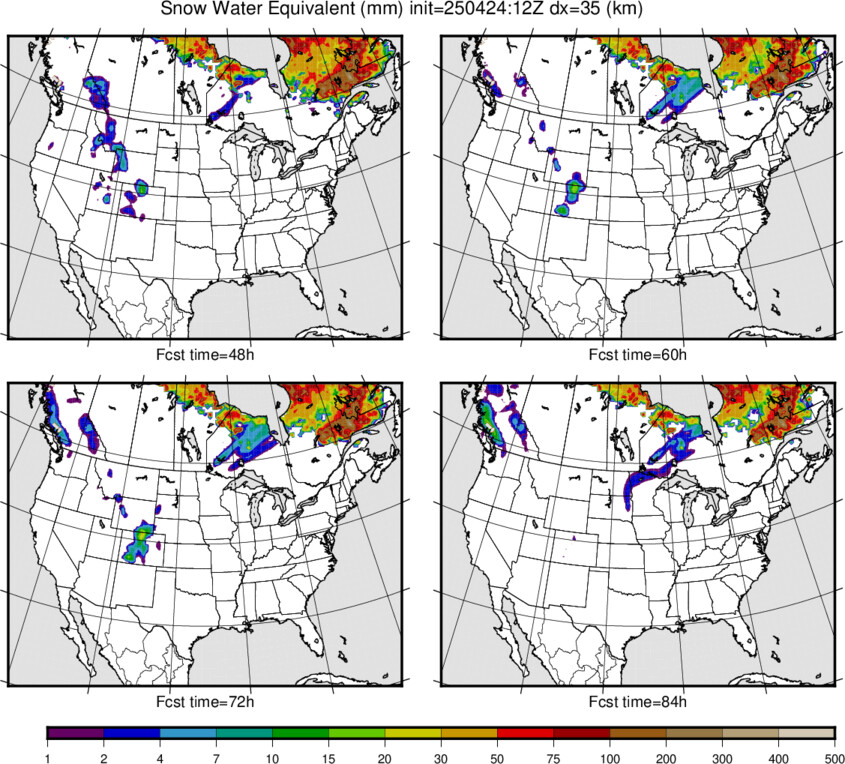
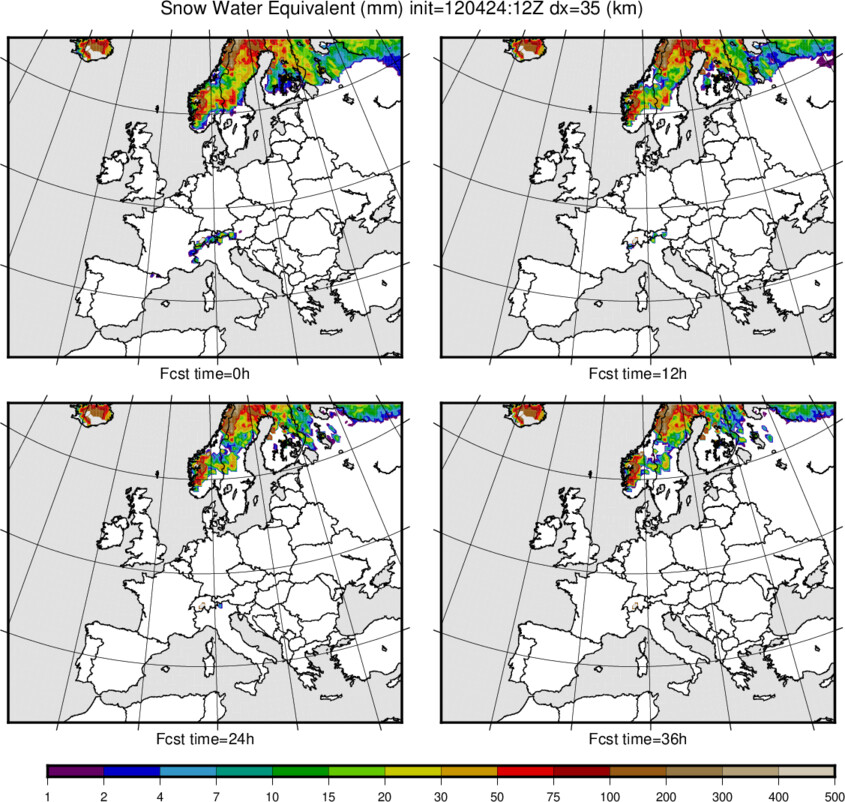
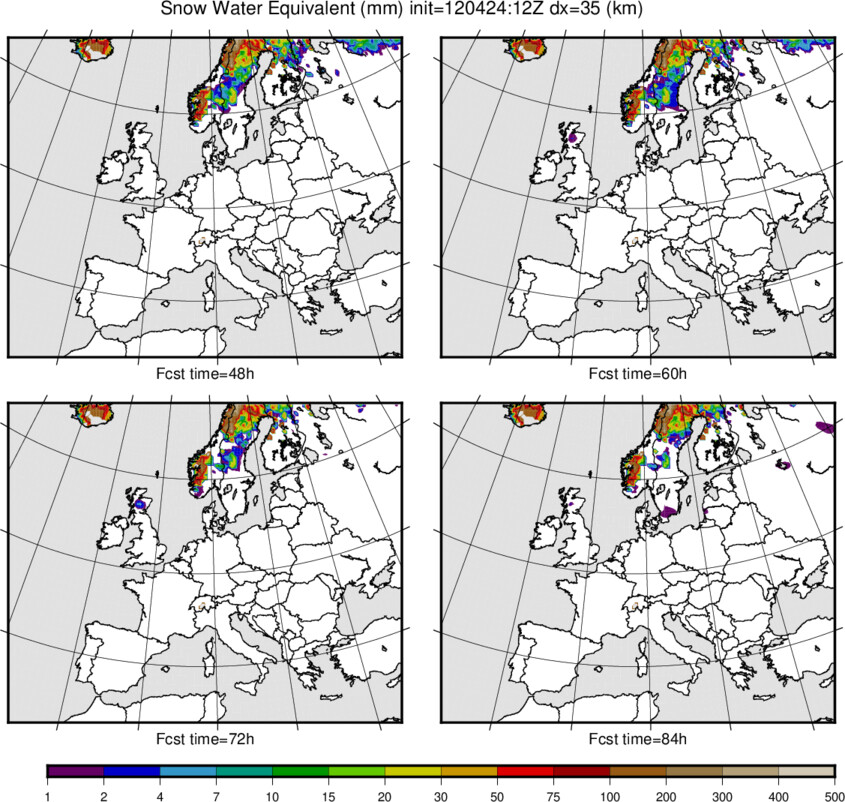
| Surface Snow Water Equivalent (SWE) | 0-36h | 48-84h | 0-36h | 48-84h |
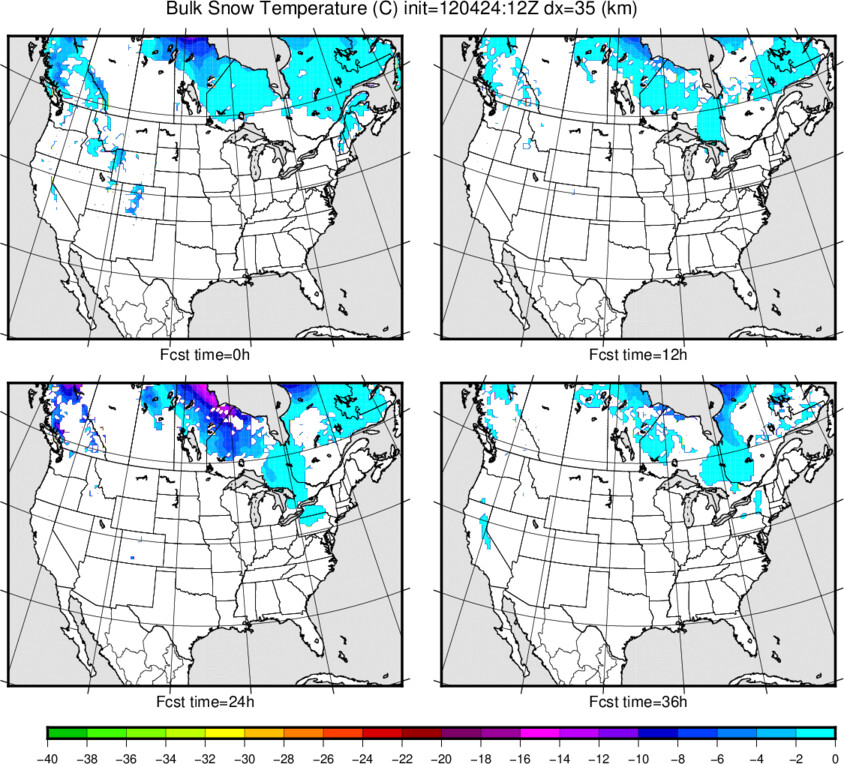
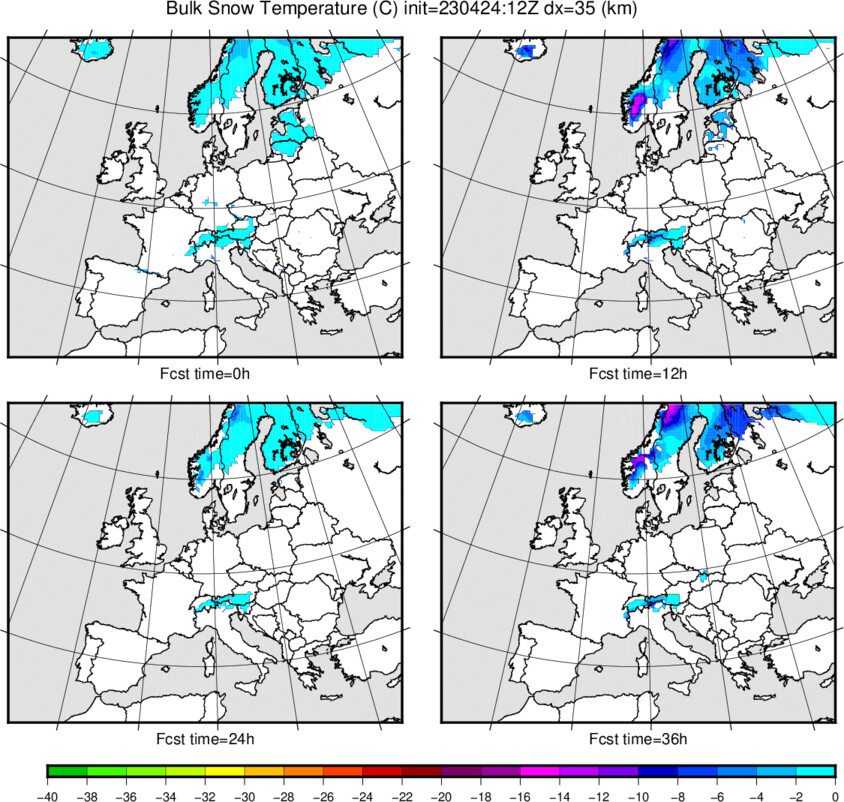
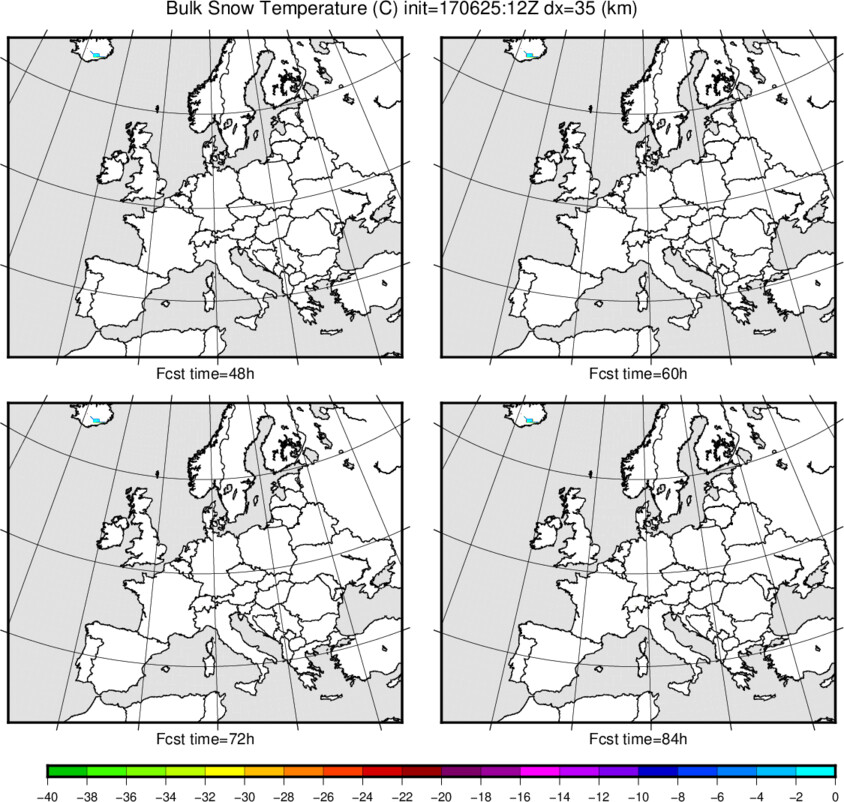
| Bulk Snow Temperature (on ground) | 0-36h | 48-84h | 0-36h | 48-84h |
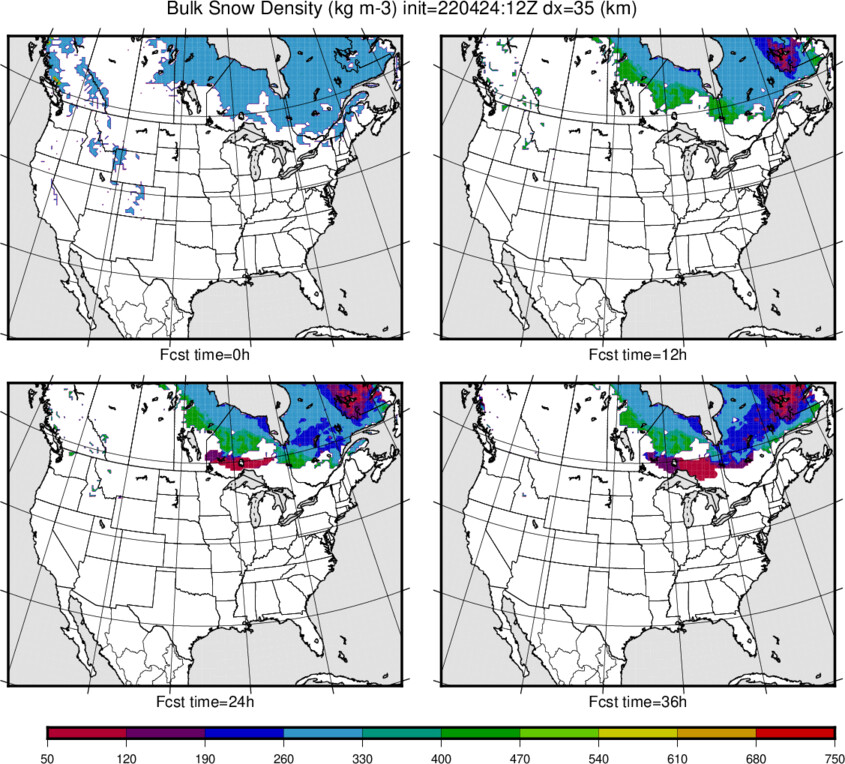
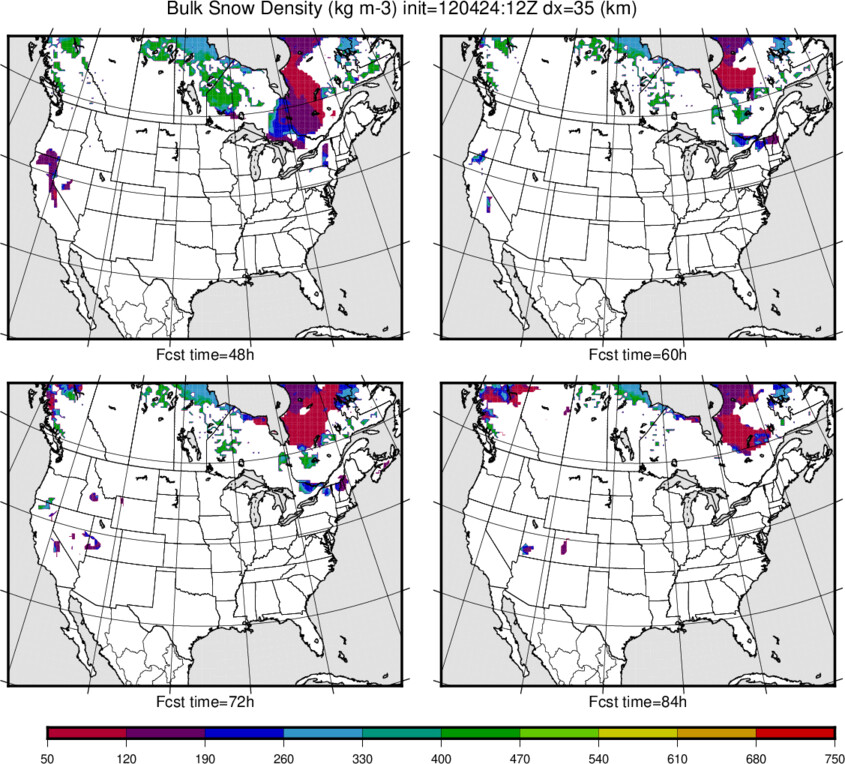
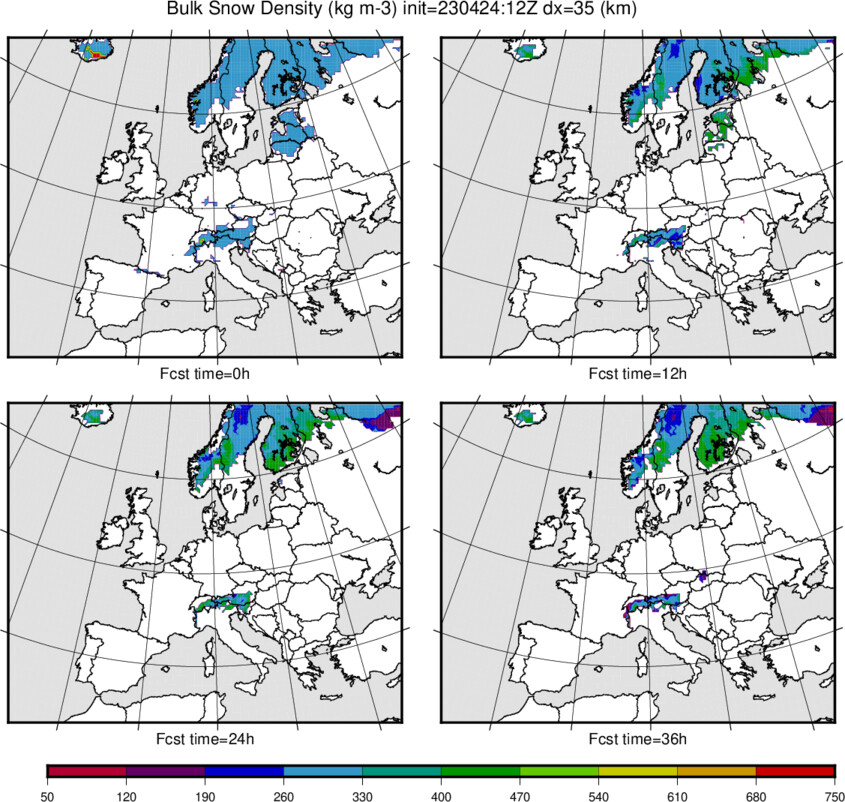
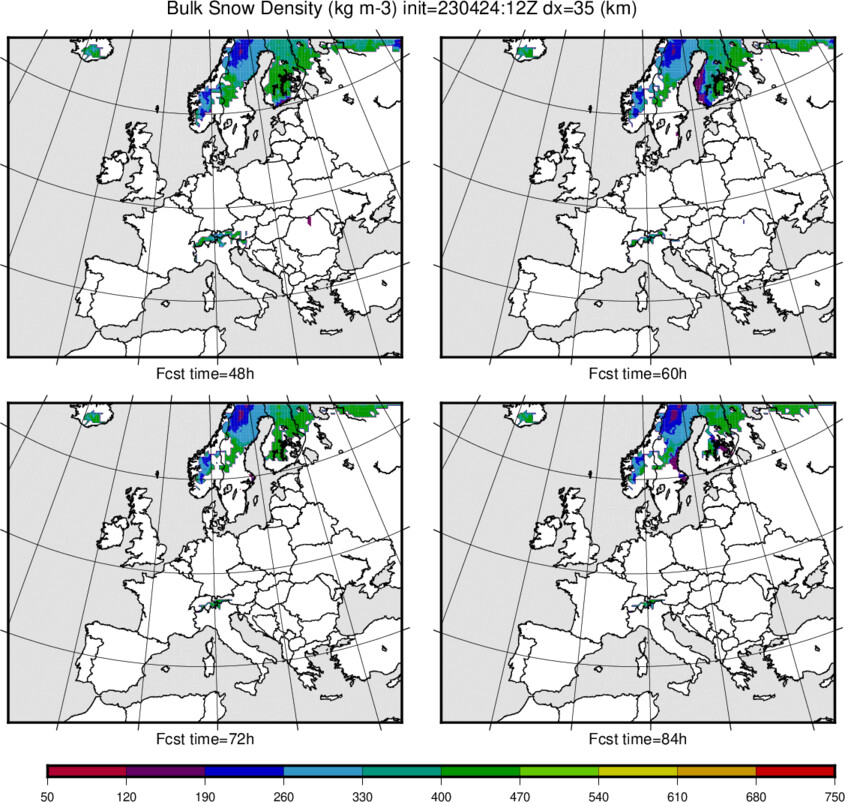
| Bulk Snow Density (on ground) | 0-36h | 48-84h | 0-36h | 48-84h |
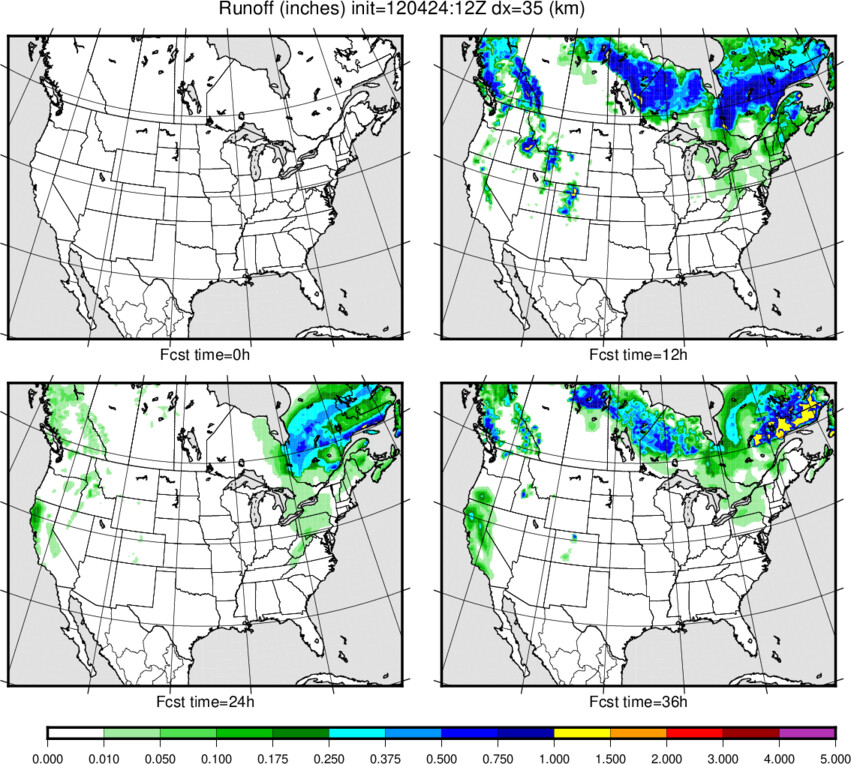
| Total Runoff | 0-36h | 48-84h | 0-36h | 48-84h |
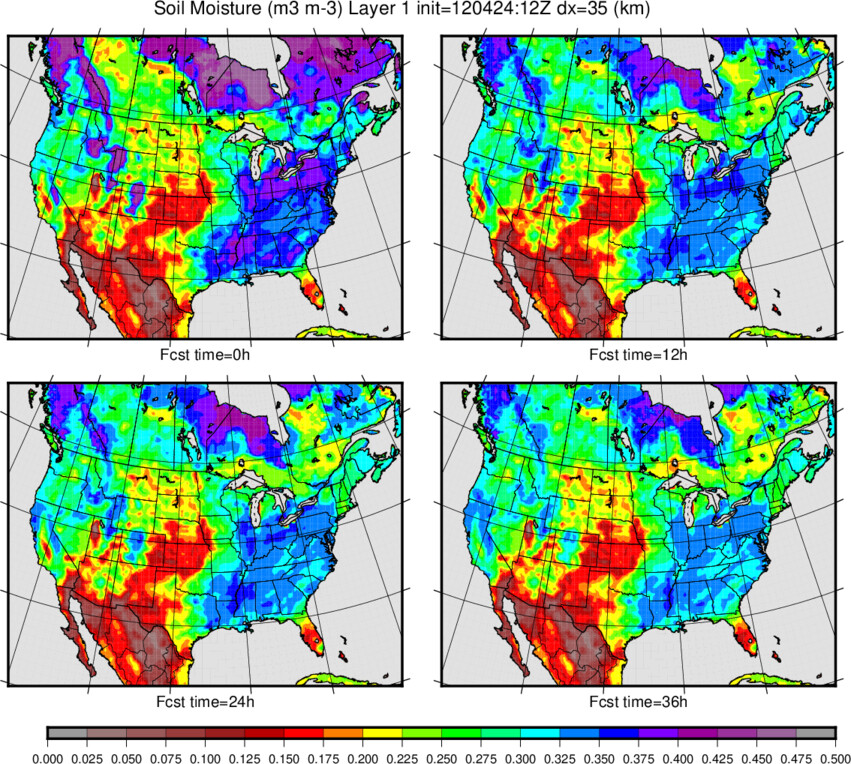
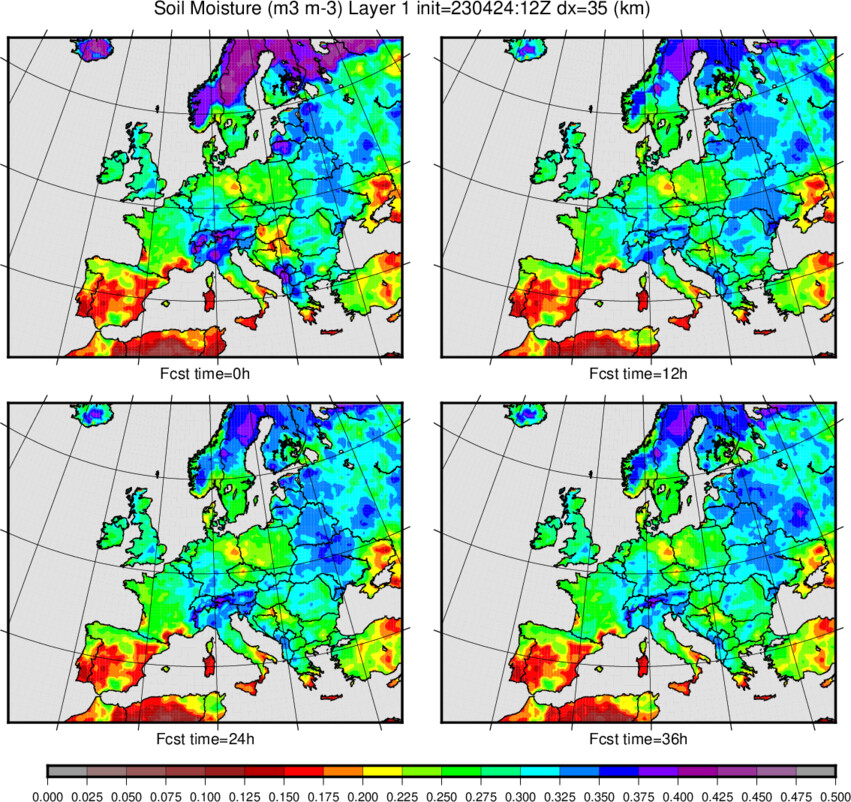
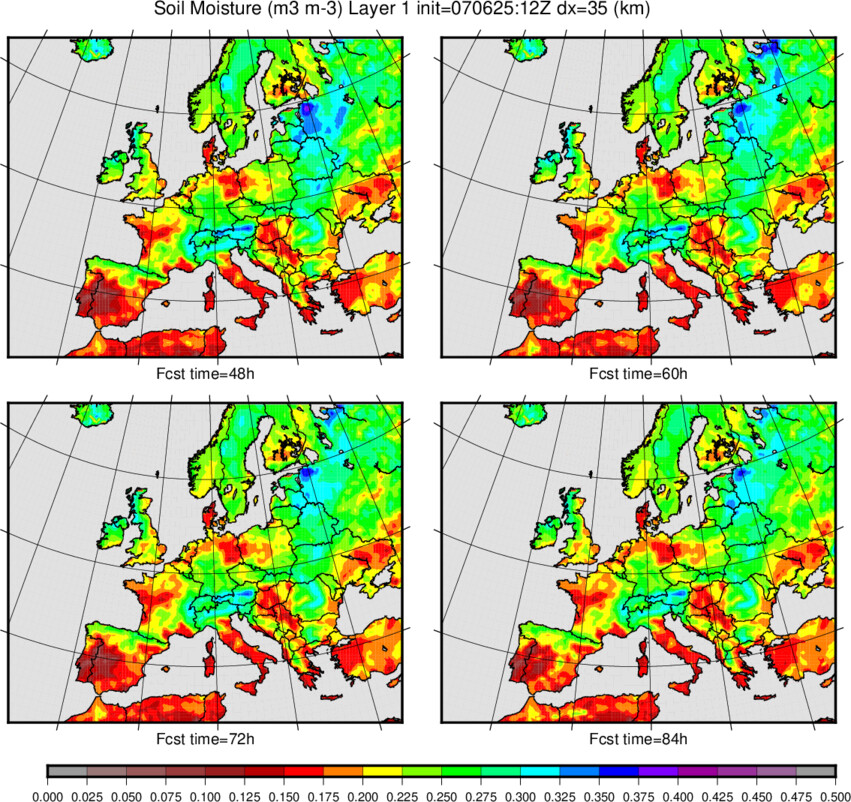
| Soil Moisture: layer 1 (0.00 to 0.03 m) | 0-36h | 48-84h | 0-36h | 48-84h |
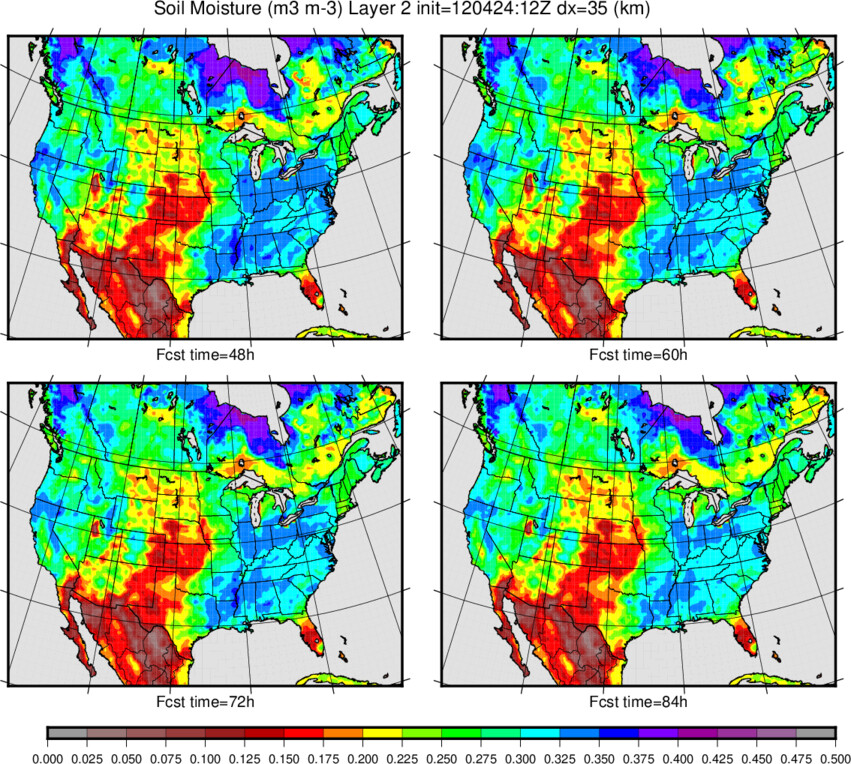
| Soil Moisture: layer 2 (0.03 to 0.10 m) | 0-36h | 48-84h | 0-36h | 48-84h |
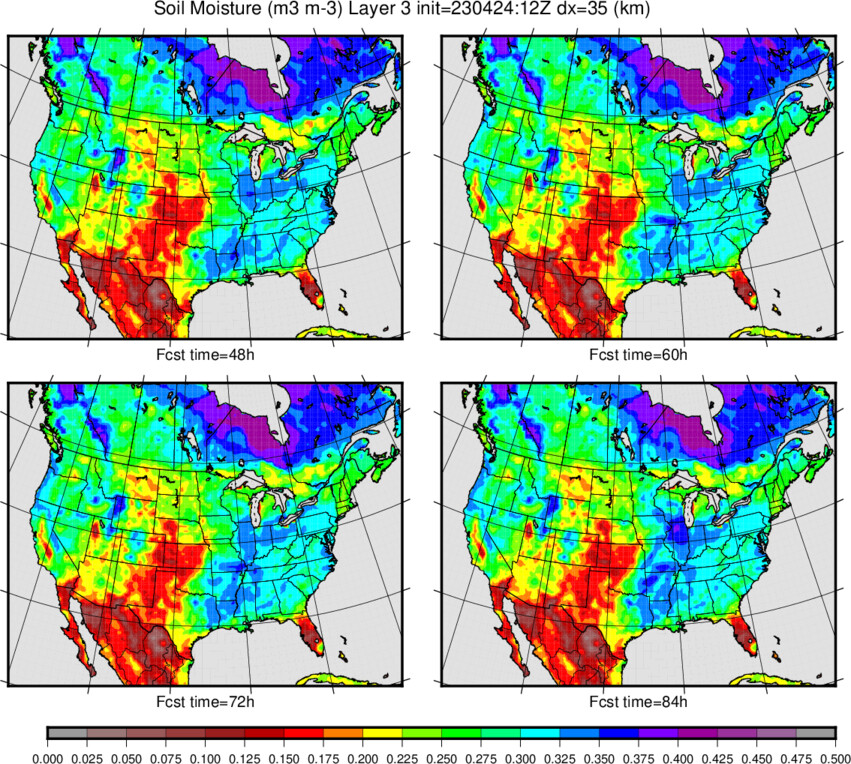
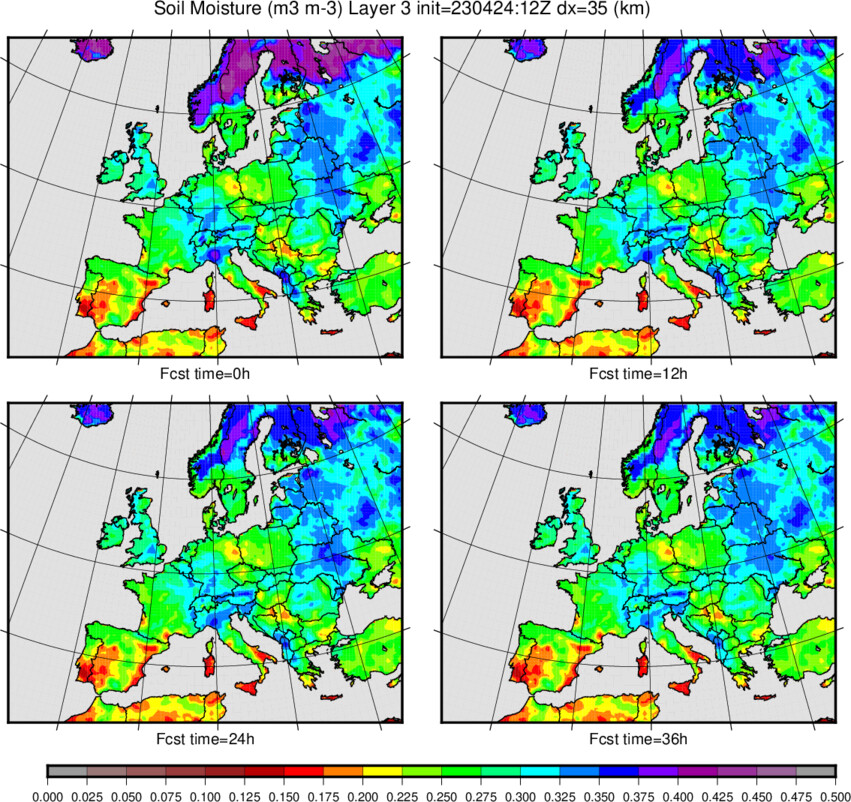
| Soil Moisture: layer 3 (0.10 to 0.40 m) | 0-36h | 48-84h | 0-36h | 48-84h |
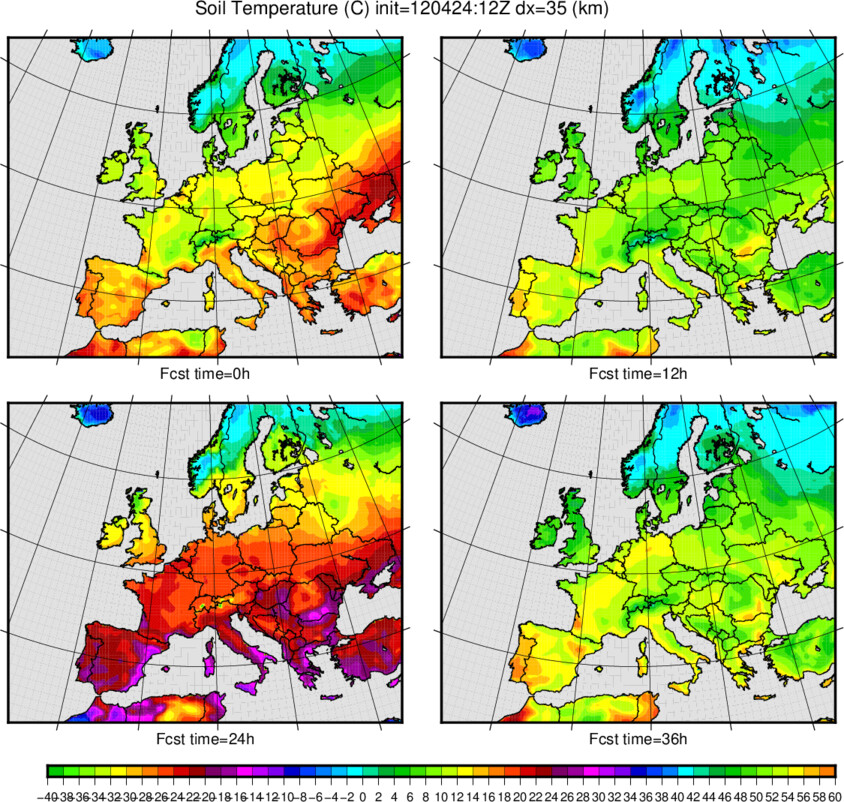
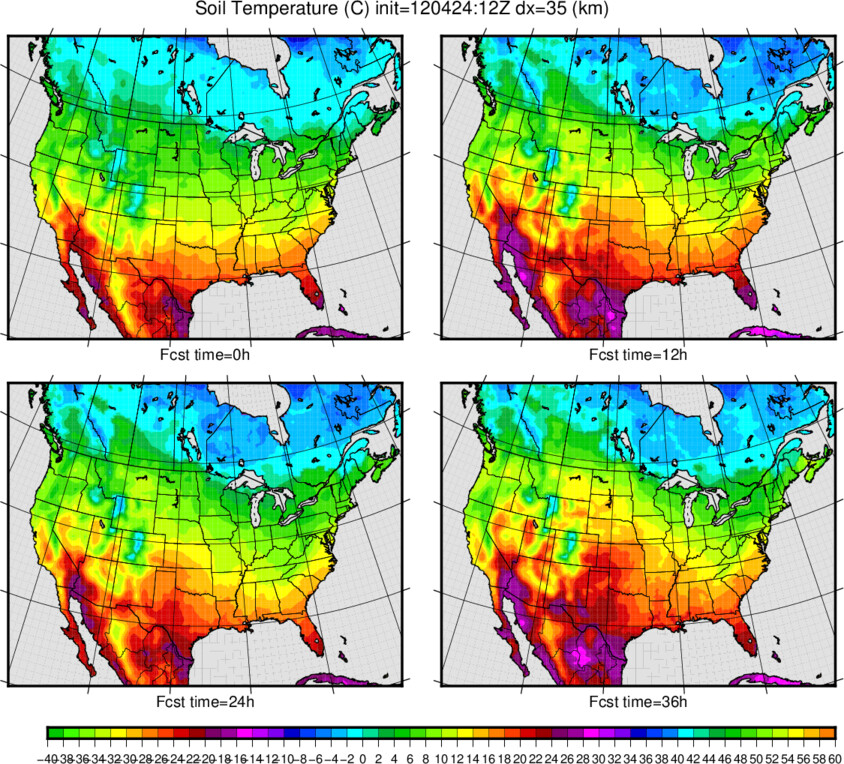
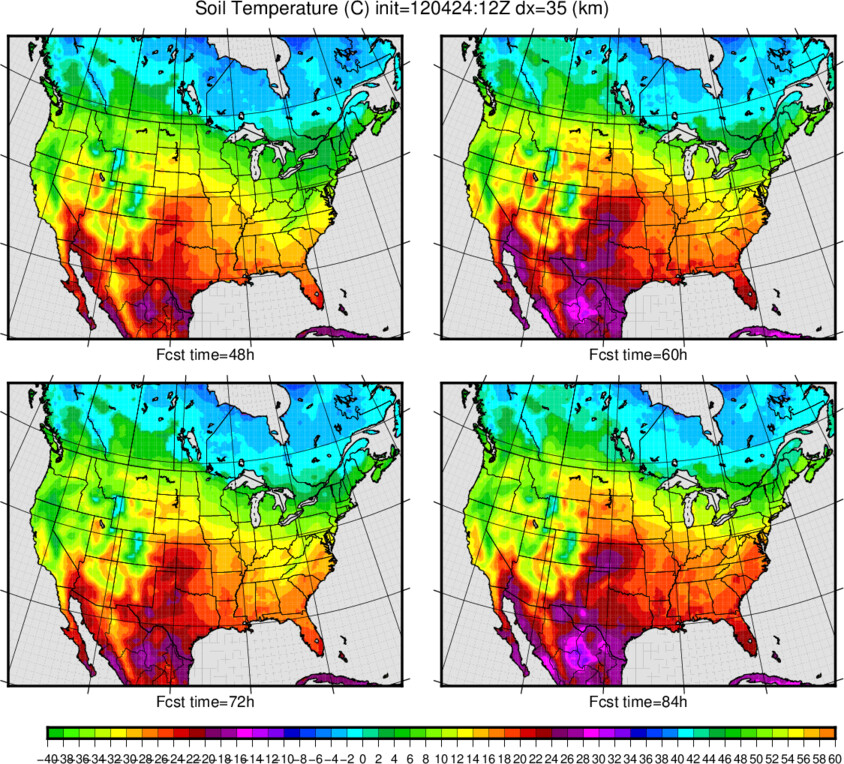
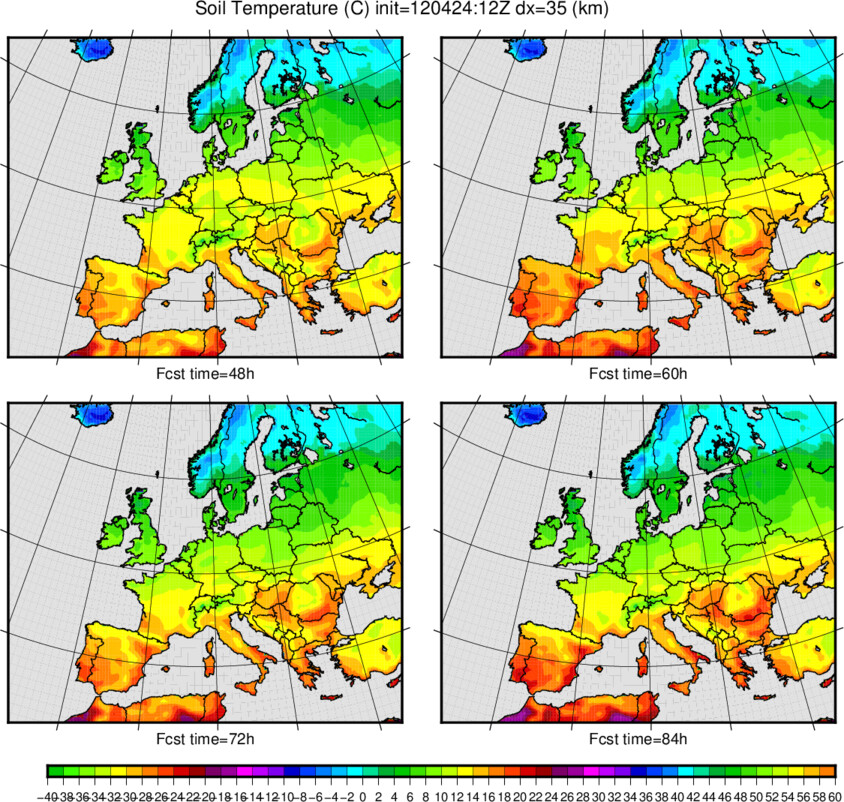
| Soil Temperature: layer 1 (0.00 to 0.03 m) | 0-36h | 48-84h | 0-36h | 48-84h |
| Soil Temperature: layer 2 (0.03 to 0.10 m) | 0-36h | 48-84h | 0-36h | 48-84h |
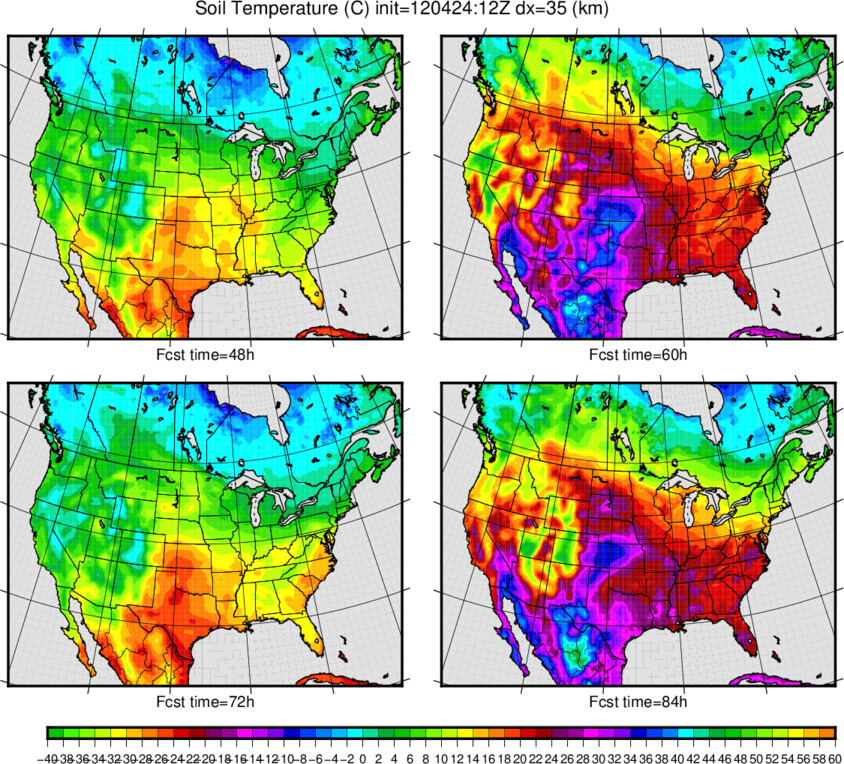
| Soil Temperature: layer 3 (0.10 to 0.40 m) | 0-36h | 48-84h | 0-36h | 48-84h |
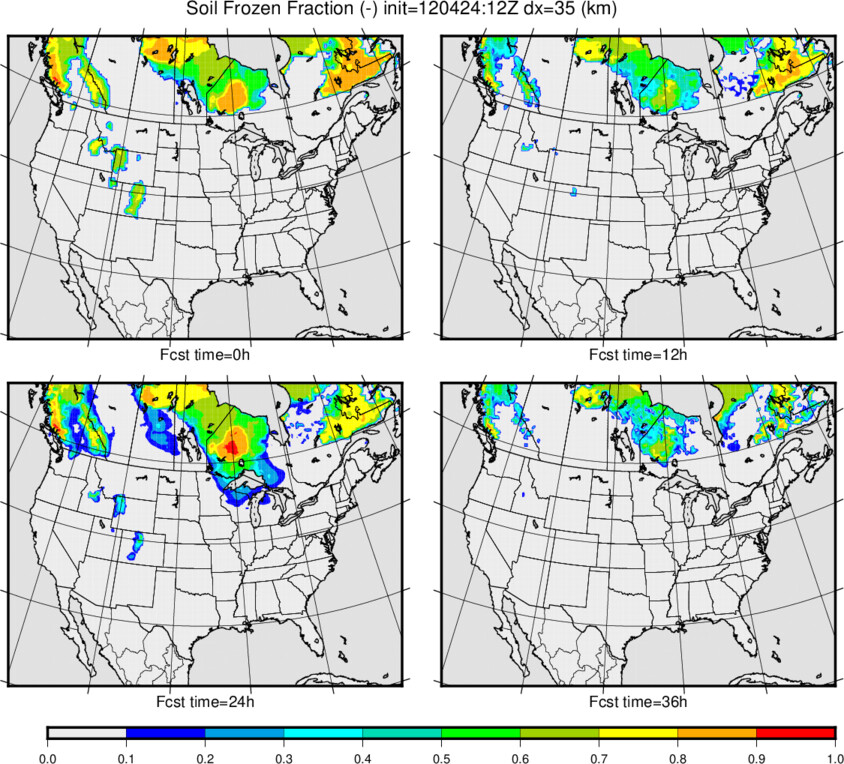
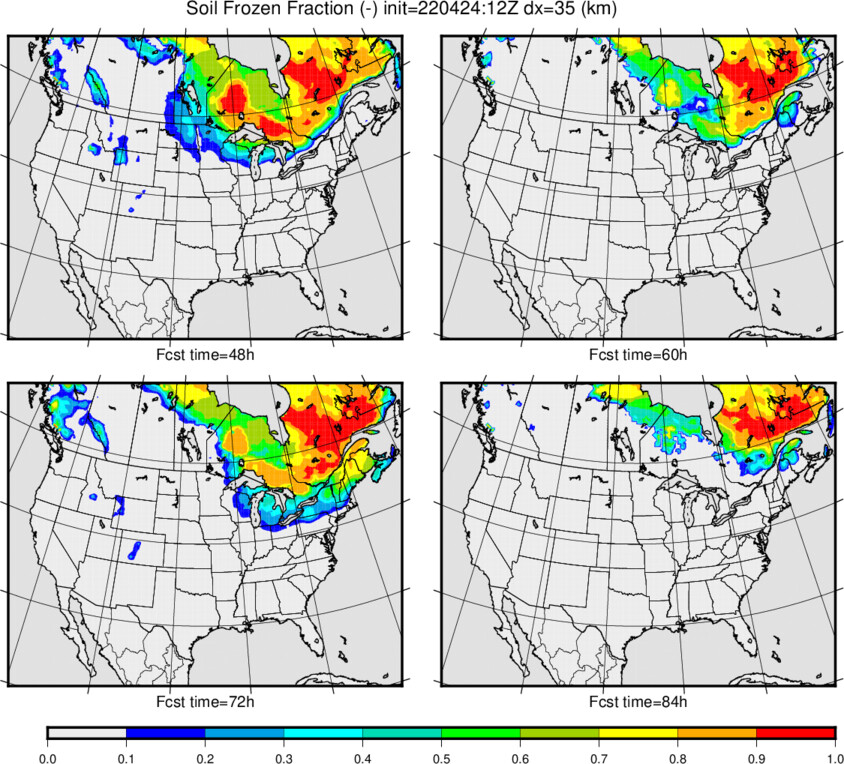
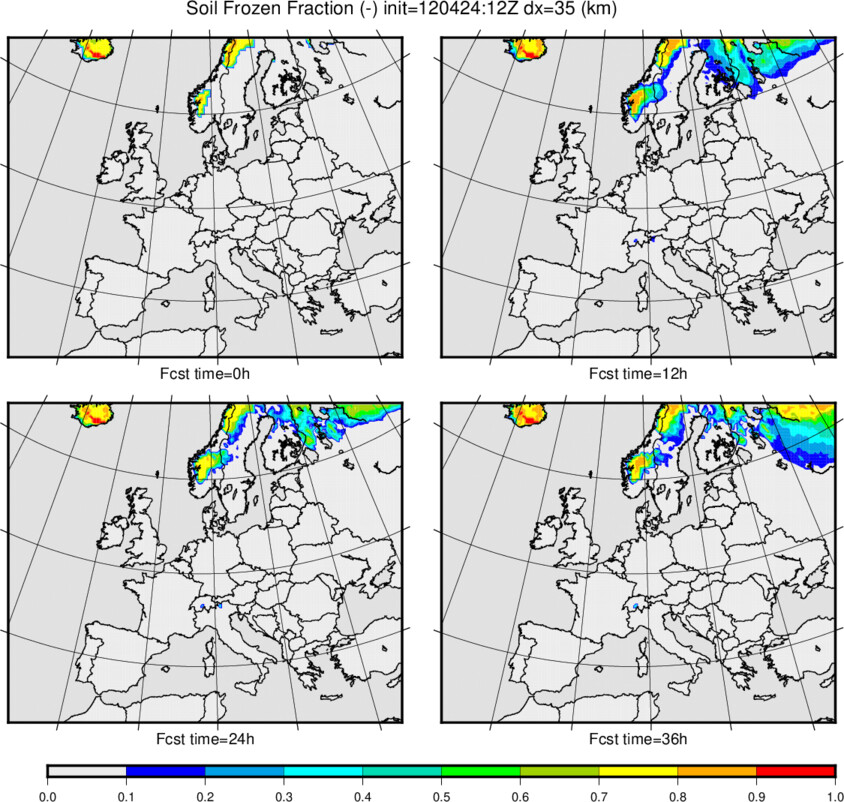
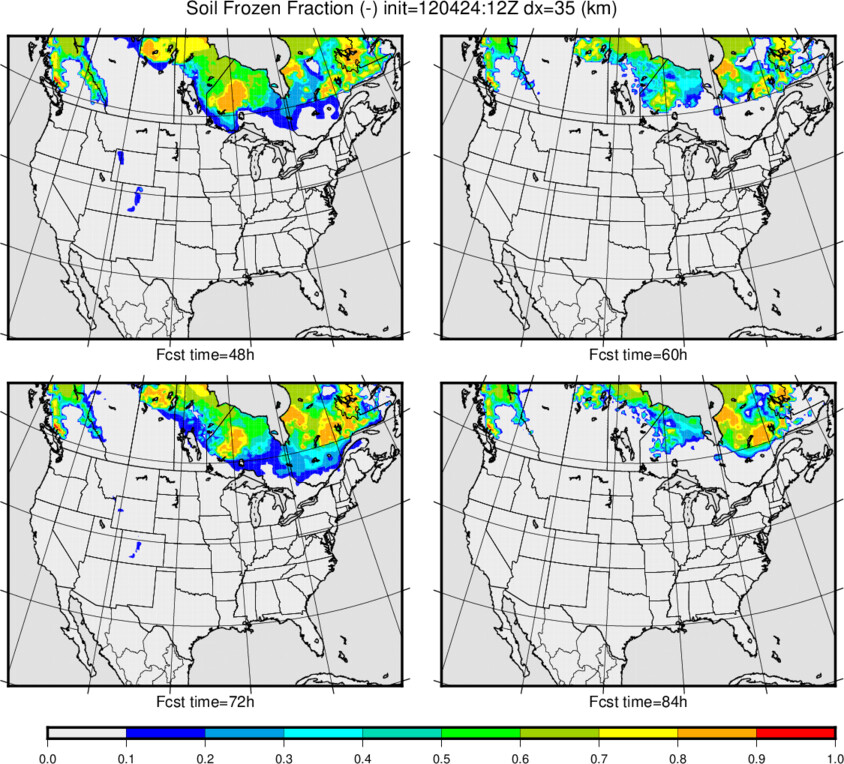
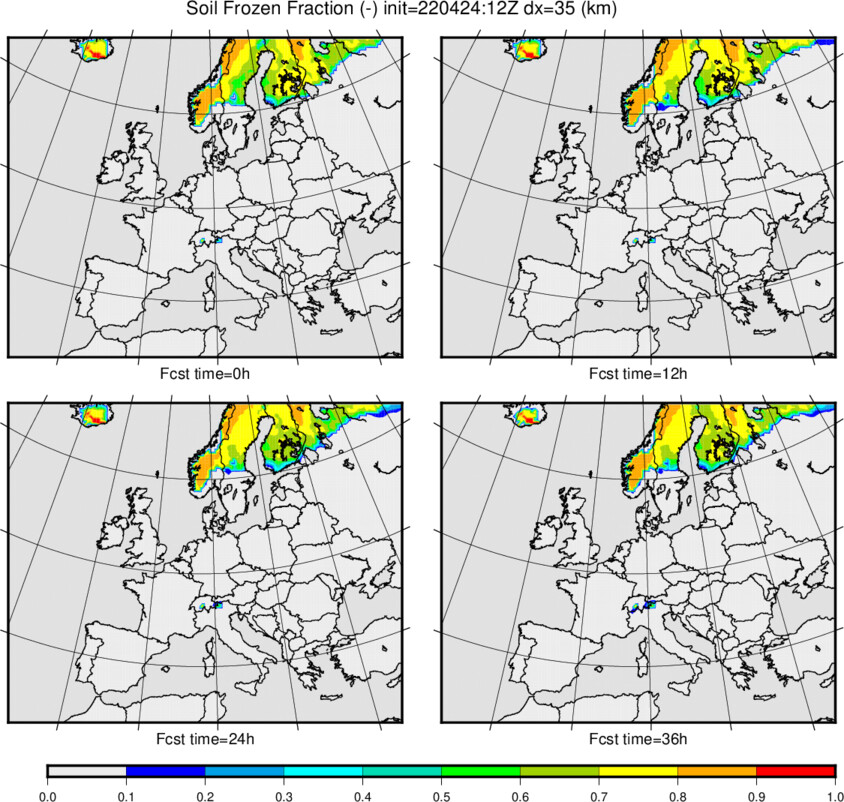
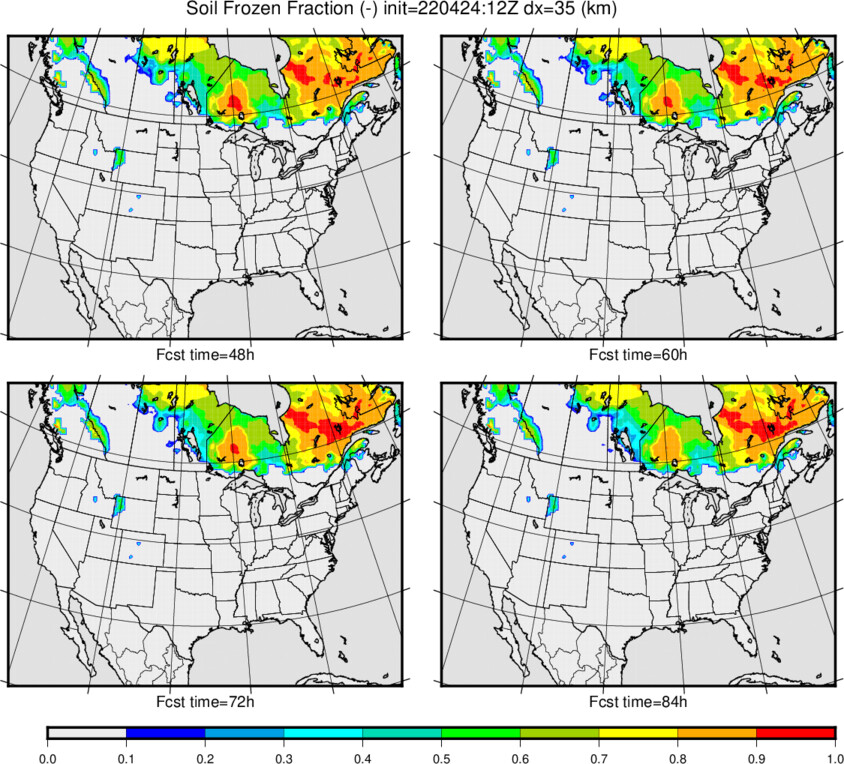
| Frozen Soil: layer 1 (0.00 to 0.03 m) | 0-36h | 48-84h | 0-36h | 48-84h |
| Frozen Soil: layer 2 (0.03 to 0.10 m) | 0-36h | 48-84h | 0-36h | 48-84h |
| Frozen Soil: layer 3 (0.10 to 0.40 m) | 0-36h | 48-84h | 0-36h | 48-84h |
- Key:
- Hgt = Geopotential Height (m)
- WindS = Wind speed
- WindV = Wind vectors
- Tair = Air Temperture
- AbsVort = Absolute Vorticity
- VVel = Vertical velocity defined as -omega (+ for upward motion)
- Qair = Specific Humidity
- Precip = Cummulative total (convective and stratiform) Precipitation for each forecast interval
- Convct Precip = Cummulative convective Precipitation for each forecast interval
- Convct Precip Frac = Ratio of Cummulative convective to total precipitation for each forecast interval
- Froz Precip = Cummulative Frozen total Precipitation (liquid water equivalent)
- Precipitable Water = Total vertically integrated water vapor (inches)
- Thck = Pressure thickness
- High level Clouds = Clouds above approximately 400 mb (standard atmosphere)
- Medium level Clouds = Clouds between approximately 800 and 400 mb (standard atmosphere)
- Low level Clouds = Clouds below approximately 800 mb (standard atmosphere)
- 850mb-0deg = 850mb 0 degree C isotherm
- Lowest Model Level = Currently corresponds to eta=0.997 or about 30 m above the ground (less in high altitude zones)
- Near-Surf = 2m Tair and 10m Wind speed (i.e. at the level of standard measurements)
- Evapc = Cummulative Surface evaporation (mm day-1 over forecast interval)
- TSurf = Surface temperature: combined surface vegetation and upper thin soil layer or SST (Sea Surface Temp.)
- SWdown = downwelling shortwave radiation flux at the surface (W m2)
- LWdown = downwelling longwave radiation flux at the surface (W m2)
- PBLz = Planetary Boundary Layer Depth (thickness: distance from top of PBL to surface) (m)
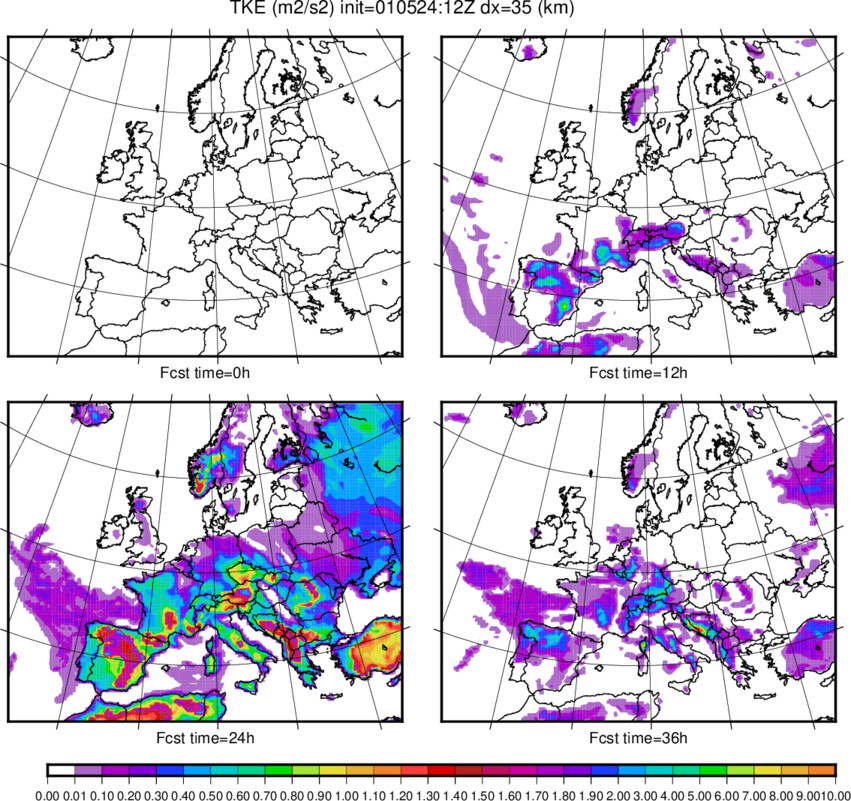
- TKE = Turbulent Kinetic Energy (m2 s-2)
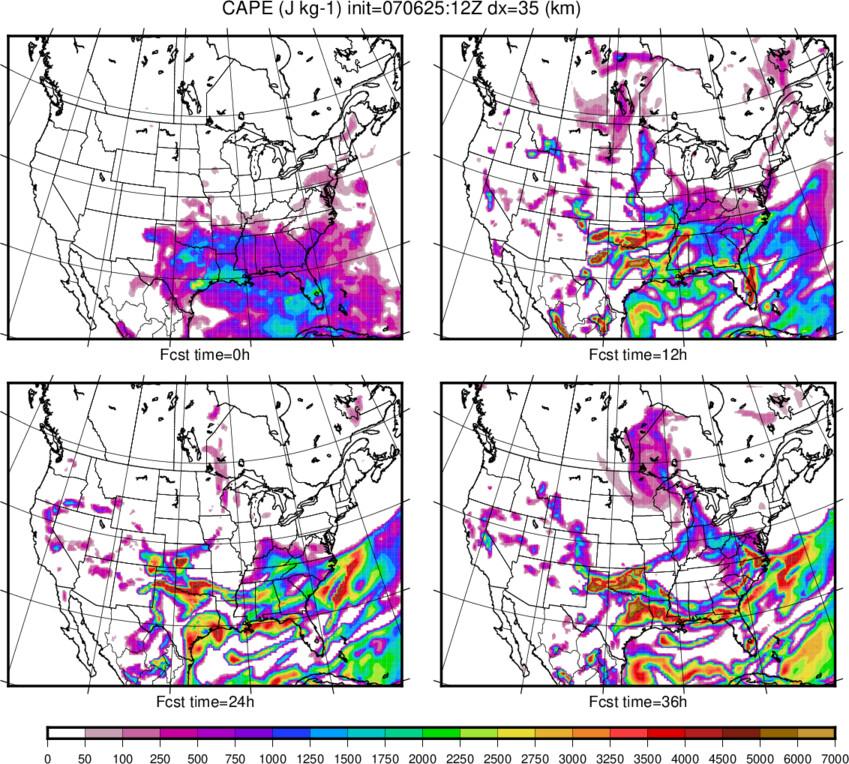
- CAPE = Convective Available Potential Energy (J kg-1)
- CIN = Convective Inhibition (J kg-1)
- CMassFlx = Convective mass flux (+up): mass flux at cloud base
- SnowF = Cummulative snowfall depth (inches) for each forecast interval
- SnowDepth = Snow depth (inches) on the ground
- SWE = Snow Water Equivalent depth (mm) on the ground
- Snow Density = Bulk Snow density (kg m-3) on the ground
- Snow Saturation = snow liquid water saturation (on the ground)
- Snow Temperature = Bulk Snow Temperature (K) on the ground
- Runoff = Cummulative Total runoff (and drainage) for each forecast interval
- Soil Moisture = layer average volumetric water content (m3/m3)
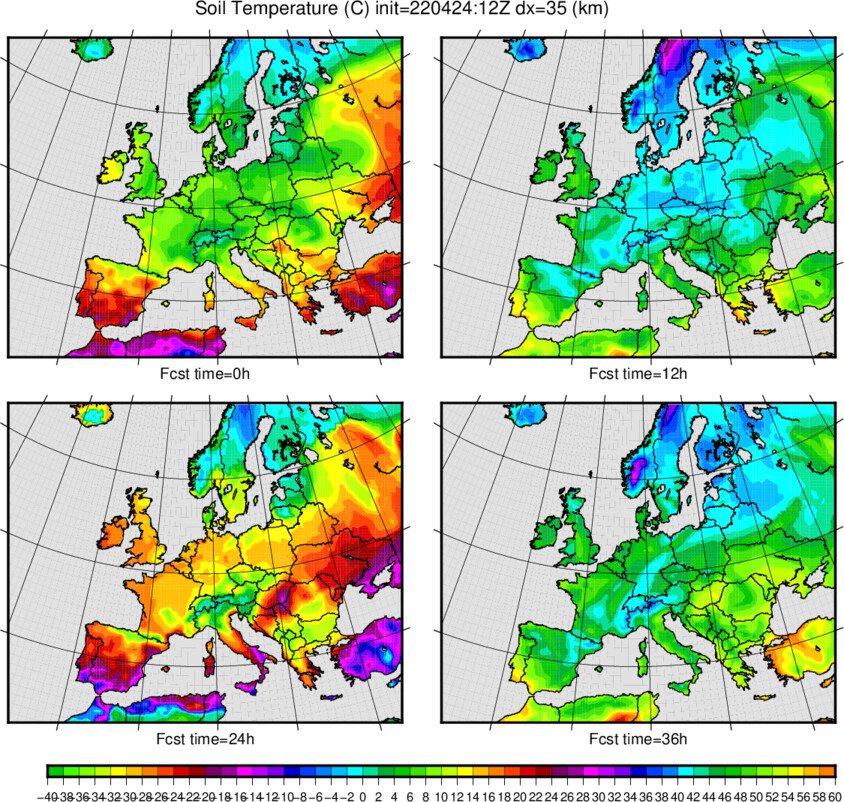
- Soil Temperature = layer average soil temperature (C)
- Frozen Soil = layer average Fraction of total water content which is ice (-), ranges from 0 to 1 (totally frozen)
* NOTE on the 850 mb 0-C Isotherm - the 850 mb air temperature is replaced by the lowest level atmospheric temperature if the corresponding pressure is below 850 mb. This is more relevant in mountainous terrain.
** NOTE on the snow plots: this plot is made simply by assuming a 12-1 ratio between snow fall depth (Snowf) and the liquid water equivalent snowfall depth. It simply represents the potential depth of snowfall (precipitation thickness), and does not consider snowpack processes such as compaction or melting of snowpack (snowpack physics), nor a variable snowfall density. SnowDepth corresponds to the actual depth of the snowpack on the surface, and it changes in time owing to compaction, settling, sublimation, melting, and accumulation.
*** NOTE on the Runoff plot: it is the sum of all water leaving the soil column, and consists in sub-grid surface (fast response) Dunne runoff, deep-soil drainage, and any excess saturation. In this simple representation, it is assumed to either flow laterally to nearest river, or to flow to deeper soil reservoirs/aquifers.
Standard Atmosphere: Pressure-Height correspondence
As a reference, the pressure levels above correspond to the approximate heights below in meters (and feet) for a standard atmosphere. Note that actual heights can vary considerably as a function of season, location etc.
| Pressure (HPa or mb) | height (meters) | height (feet) |
| 100 | 16170 | 53051 |
| 200 | 11770 | 38616 |
| 300 | 9160 | 30053 |
| 500 | 5570 | 18274 |
| 700 | 3000 | 9843 |
| 850 | 1460 | 4790 |
| 925 | 760 | 2493 |
| 1013.25 | 0 | 0 |
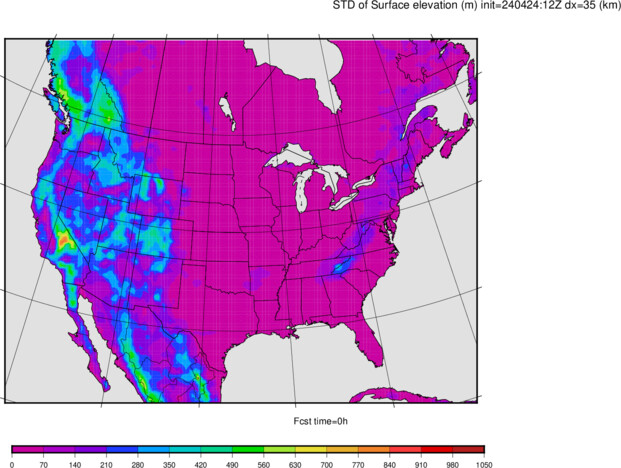
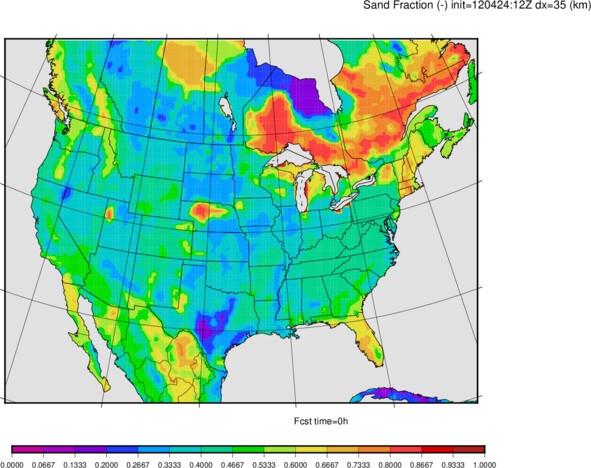
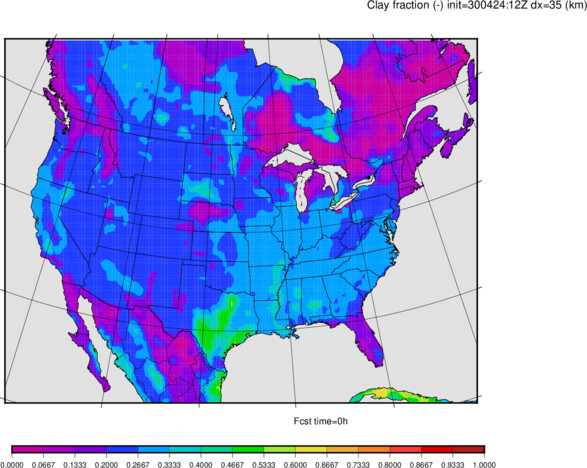
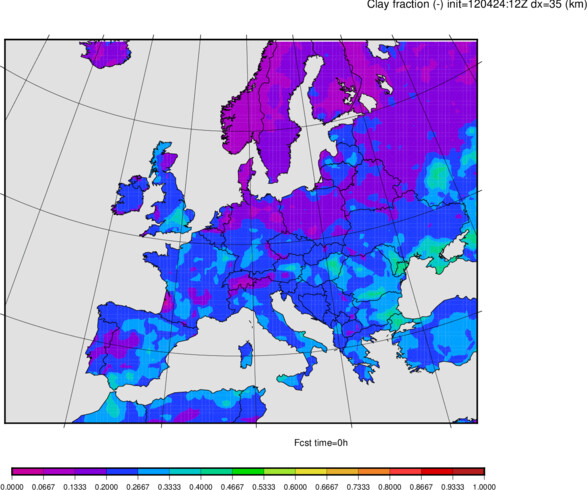
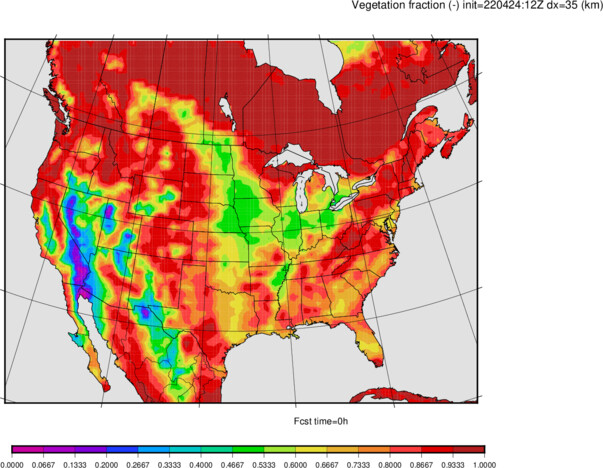
Physiographic Input Plots
Plots can be seen here for 2 domains (North America, and Europe). Selected input fields consisting in soil, vegetation and topography data are shown here. Vegetation fields vary as a function of month currently, all other fields are fixed in time.
| Field | North America | Europe |
| Elevation (m) | X | X |
| Standard deviation of orography | X | X |
| Sand fraction | X | X |
| Clay fraction | X | X |
| Leaf Area Index (LAI) | X | X |
| Vegetation cover fraction | X | X |
| Snow-free land surface albedo | X | X |
| Snow-free soil-vegetation surface roughness | X | X |
* NOTE on Snow-free soil-vegetation roughness:
this does not include additional increases in roughness
owing to sub-grid orography effects (in the model,
the total roughness, including orography and snow, is used
to compute the drag coefficients).
Please note that this page has nothing to do with
my employer, CNRS, or where I am employed, at the National
Center for Meteorological Research (Centre National de
Recherches Meteorologiques: CNRM) at Meteo-France.
The opinions expressed herein are my own, and are not a
reflection of those where I work or of my employer.
Finally, a special thanks is extended to the United States
National Centers for Environmental Prediction (NCEP)
for making
GFS analysis and forecast data freely available in near real time,
which makes applications and research such as this possible.
Disclaimer
Acknowledgement